
Figure 4. pho23Δ Cells Maintain Higher ATG9 Expression Levels Relative to the Wild-Type after Autophagy Is Activated.
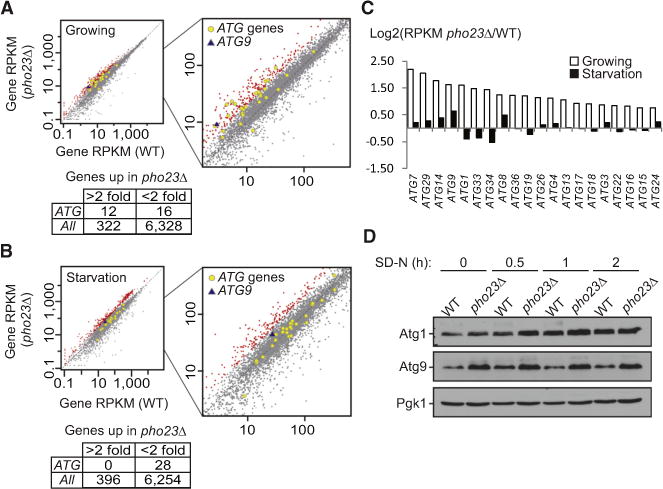
(A and B) Gene RPKM (reads per kilobase per million mapped reads) values under growing (A) or 2 hr nitrogen starvation (B) conditions are shown for the wild-type (SEY6210) versus the pho23Δ (JMY047) strains. Genes with expression changes more than 2-fold in pho23Δ cells are highlighted in red, while ATG genes are indicated by gray-outlined yellow circles and ATG9 is indicated by a blue triangle.
(C) The ratio of the gene RPKM of the pho23Δ strain to the wild-type is calculated for the top hits among the ATG genes.
(D) Atg1 and Atg9 protein levels in wild-type (TVY1) and pho23Δ (JMY020) cells in the pep4Δ background after 0, 0.5, 1, and 2 hr nitrogen starvation were analyzed by western blot. Pgk1 was used as a loading control.
See also Tables S3 and S4.