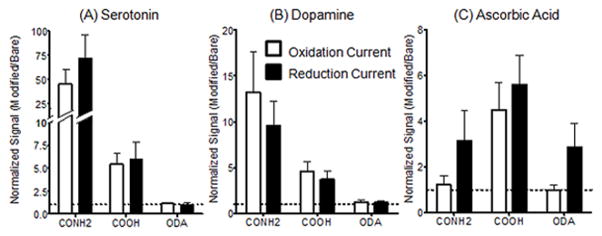
Figure 4.

Averaged data comparing normalized peak currents. Signals after CNT modification are normalized by dividing by the current before modification for each electrode. These ratios were then averaged. Error bars are standard error of the mean. The dotted line at 1.0 marks no change in signal after electrode modification. Normalized values for (A) 10 μM serotonin, (B) 10 μM dopamine, and (C) 200 μM ascorbic acid show that the sensitivity to different analytes is dependent on surface functional groups. See Table 1 for sample group sizes.
