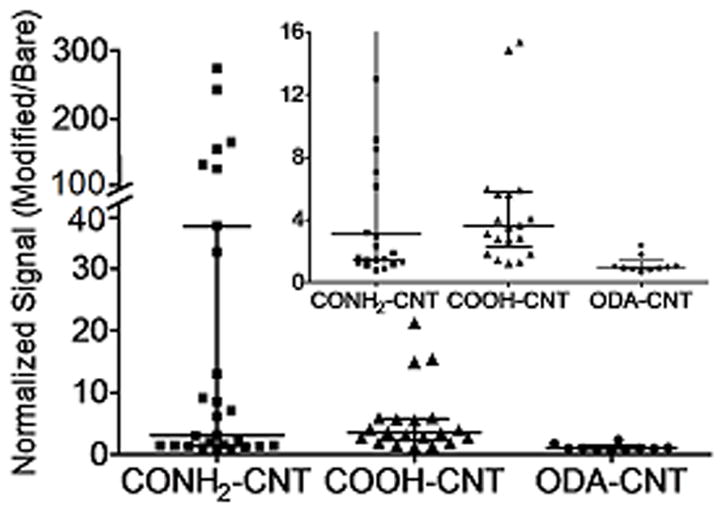
Figure 5.

Scatter plots of normalized oxidation signal for 10 μM serotonin comparing the effects of carbon nanotube-modified electrodes with different functional groups: CONH2-CNT, COOH-CNT and ODA-CNT. On the scatter-whisker plots, the short horizontal lines outline the quartiles, long horizontal lines denote the median and points represent individual data points. The inset is magnified to better display lower signals.
