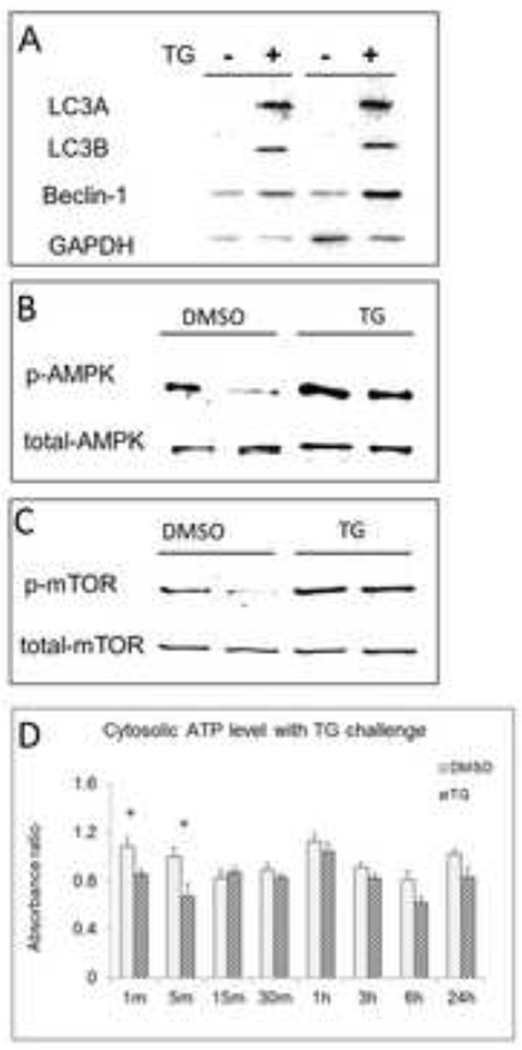
Figure 4.
In vitro, western blot data showing the expression of (A) autophagy makers LC3A and LC3B, Beclin-1, (B) phosphorylation of AMPK, and (C) mTOR in TG treated HepG2 cells. (D) Cytosolic ATP level alteration in HepG2 cell with TG challenge. Data are mean ± SEM. * p<0.05, TG treated group vs. vehicle treated group.

