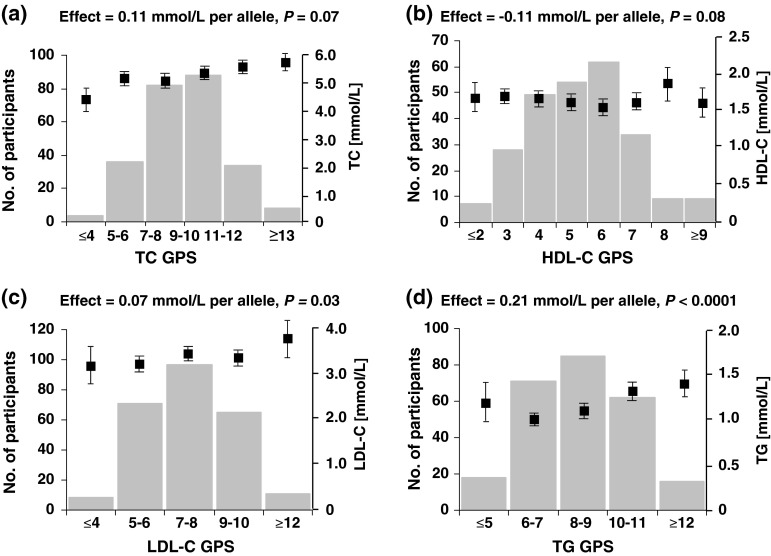
Fig. 1.
Variation in plasma concentrations of a TC, b HDL-C, c LDL-C and d TG at baseline by trait-specific GPS. The number of participants for each GPS is indicated by the bars corresponding to the left-hand Y-axis. Data points are the mean and standard error (SE) values of plasma concentrations of a TC, b HDL-C, c LDL-C and d TG for each GPS score category defined by the number of risk alleles per individual, with units indicated on the right-hand Y-axis. GPS at the lower and upper ends for each trait were grouped due to small n. The analysis was performed by linear regression of trait at baseline using the ungrouped GPS and adjusted for age, gender and ethnicity. The P values for associations between plasma lipid concentrations and trait-specific GPS and effects per risk allele are indicated. TC total cholesterol, LDL-C low-density-lipoprotein cholesterol, HDL-C high-density-lipoprotein cholesterol, TG triglyceride

