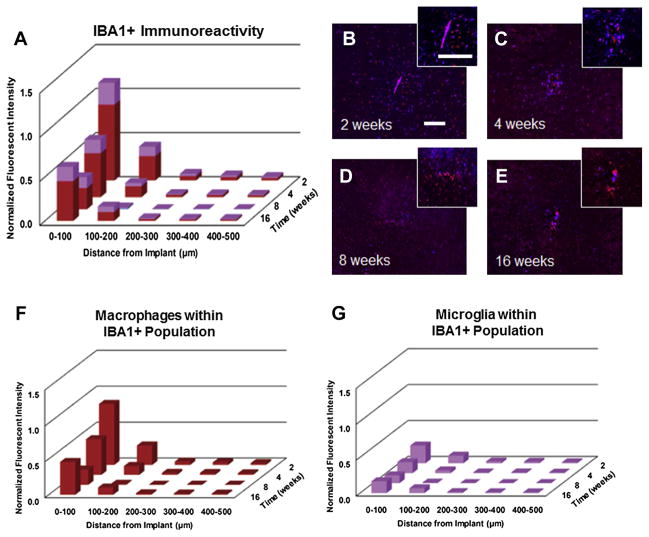
Fig. 9.
Assessment of total IBA1+ immunoreactivity surrounding intracortical microelectrodes over time. Highest levels of IBA1+ immunoreactivity was observed at two and sixteen weeks post implantation, with significantly lower IBA1+ immunoreactivity observed at eight weeks post implantation (A–E). Co-localization of CFP+ and IBA1+ immunoreactivity within the total IBA1+ population demonstrated that less than 20% of the IBA1+ population were comprised of resident microglia at two weeks, while 40% of IBA1+ population was comprised of resident microglia by sixteen weeks (F/G). scale bar = 100 μm; significance p < 0.05; n = 4–7 per cohort.

