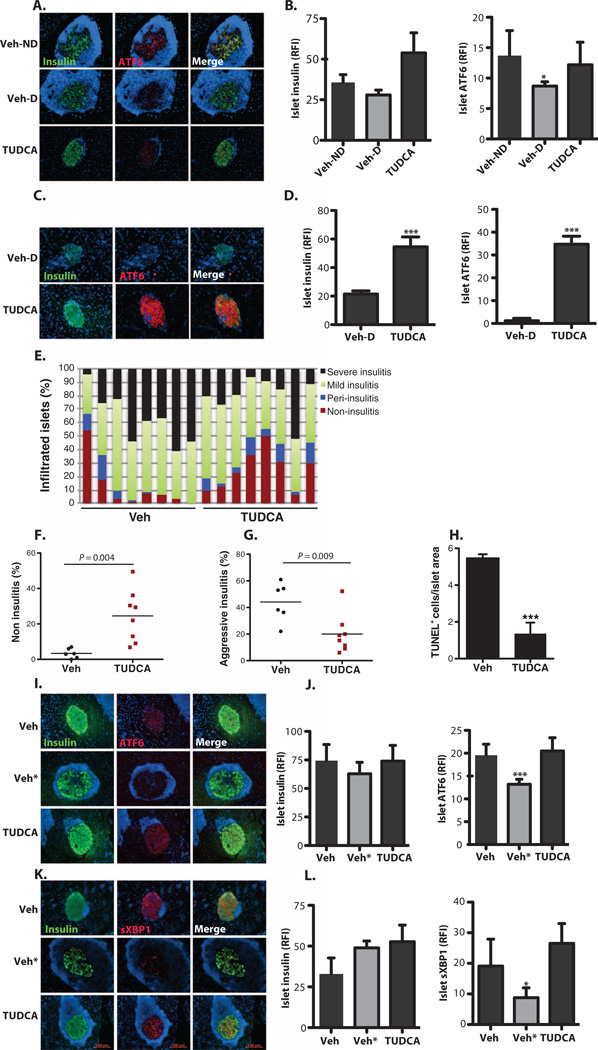
Fig. 5. Recovery of adaptive UPR mediators in islets of TUDCA-treated NOD and RIP-LCMV-GP mice.
(A) Pancreatic sections from 30-week-old vehicle-treated non-diabetic (Veh-ND) (n = 5), vehicle-treated diabetic (Veh-D) (n = 4), and TUDCA-treated (n = 9) NOD mice stained with anti-ATF6 (red) and anti-insulin (green). The cell nuclei were counterstained with DAPI (blue). (B) Quantification of relative fluorescence intensity (RFI) of insulin and ATF6 in the islets of vehicle-treated nondiabetic (Veh-ND), vehicle-treated diabetic (Veh-D), and TUDCA-treated NOD mice. (C) Pancreatic sections from 16-week-old vehicle-treated diabetic (upper panel) or TUDCA-treated RIP-LCMV-GP (lower panel) mice stained with anti-ATF6 (red) and anti-insulin (green). The cell nuclei were counterstained with DAPI (blue). (D) Quantification of islet fluorescence intensity of insulin and ATF6 in vehicle- and TUDCA-treated mice. (E) Insulitis scoring was performed on the H&E-stained step sections of the pancreata from 10-week-old NOD mice treated with either PBS vehicle (n = 8) or TUDCA (n = 8) for 4 weeks. (F) Vehicle- or TUDCA-treated NOD mouse islets were quantified for the presence of islets that did not display insulitis (*P < 0.05). (G) Vehicle- or TUDCA-treated NOD mouse islets were quantified for the presence of the islets that displayed aggressive insulitis. TUDCA-treated mice had significantly lower percentages of islets with aggressive insulitis. (H) Pancreata from control and TUDCA-treated animals were assessed for apoptosis with the TUNEL assay. (I and K) Vehicle- and TUDCA-treated normoglycemic NOD mouse pancreata were costained with (I) anti-ATF6 (red) or (K) anti-sXBPI (red) and anti-insulin (green) antibodies. Vehicle-treated animals were grouped according to their insulitis scoring [determined in (E)], and the group with the lowest insulitis scoring is shown in the upper panel. Vehicle-treated animals with severe insulitis were indicated as Veh* (middle panel). The staining of TUDCA-treated animals is shown in the lower panel. Relative fluorescence intensity analysis indicated significantly reduced (J) ATF6 and (L) sXBPI expression in the group with higher insulitis scoring, whereas TUDCA-treated animals showed a similar degree of expression to the animals with lower insulitis scoring. Insulin expression in the islets was the same in all groups (J and L). Data are presented as means ± SEM, with statistical analysis performed by one-way ANOVA (B, J, and L) or by Student′s t test (D and F to H) (***P < 0.001; *P < 0.05).

