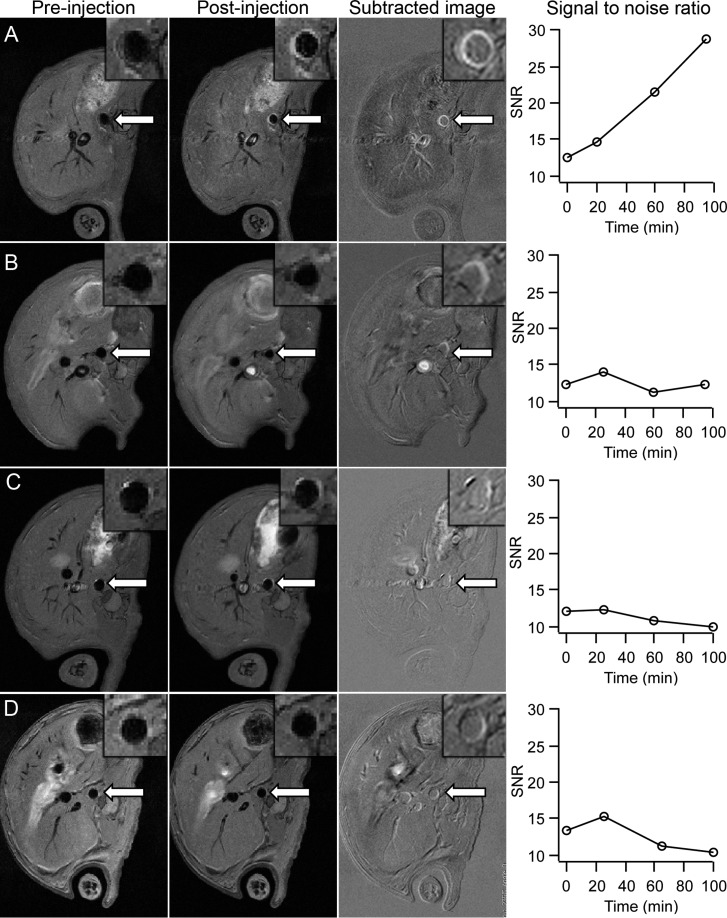
Figure 5.
Pre- and postinjection MRI scans of (A) VCAM-TMV, (B) Gd(DOTA), and (C) PBS in ApoE–/– mice, and (D) VCAM-TMV in a C57Bl/6 mouse. The third column is the subtracted image (90 min postinjection minus preinjection). The fourth column is the signal-to-noise ratio (SNR) for the vessel wall of the aortas. Insets are magnified images of the abdominal aorta regions of interest.

