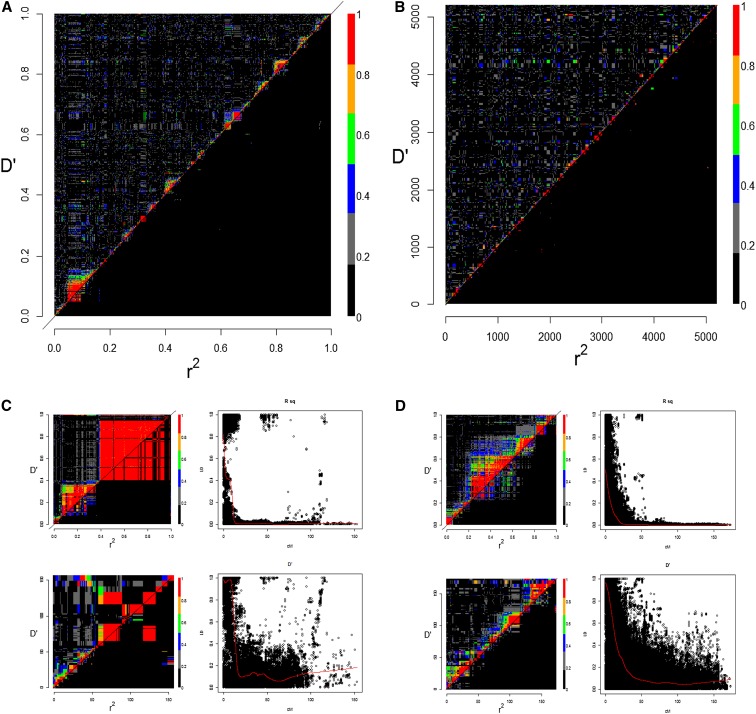
Figure 1.
Analysis of LD in the MAGIC population. (A) Heatmap of LD decay of ordered SNPs over 21 chromosomes, ordered 1A, 1B…7D, D′ above the diagonal and r2 below. (B) Heatmap of SNPs scaled by the genetic map. Each chromosome has been extended to a nominal 250 cM. Examples of individual chromosomes, LD heatmaps, and plots of LD decay are illustrated for (C) chromosome 2B and (D) chromosome 2D. (C and D) Upper left: ordered SNPs; lower left: scaled by genetic map; upper right: D′ plotted against genetic distance; lower right: r2 plotted against genetic distance.

