
Figure 3.
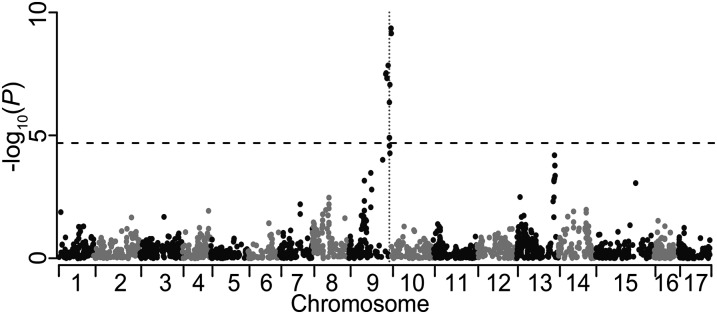
Manhattan plot of a single marker association analysis for apple skin color. Each of the 3967 SNPs is plotted according to its physical position from the "Golden Delicious" reference genome and the −log10 P value of the single marker association test. The horizontal dotted line represents the Bonferonni-corrected P value significance threshold. The vertical dotted line represents the location of the MYB transcription factor gene known to be responsible for skin color variation.