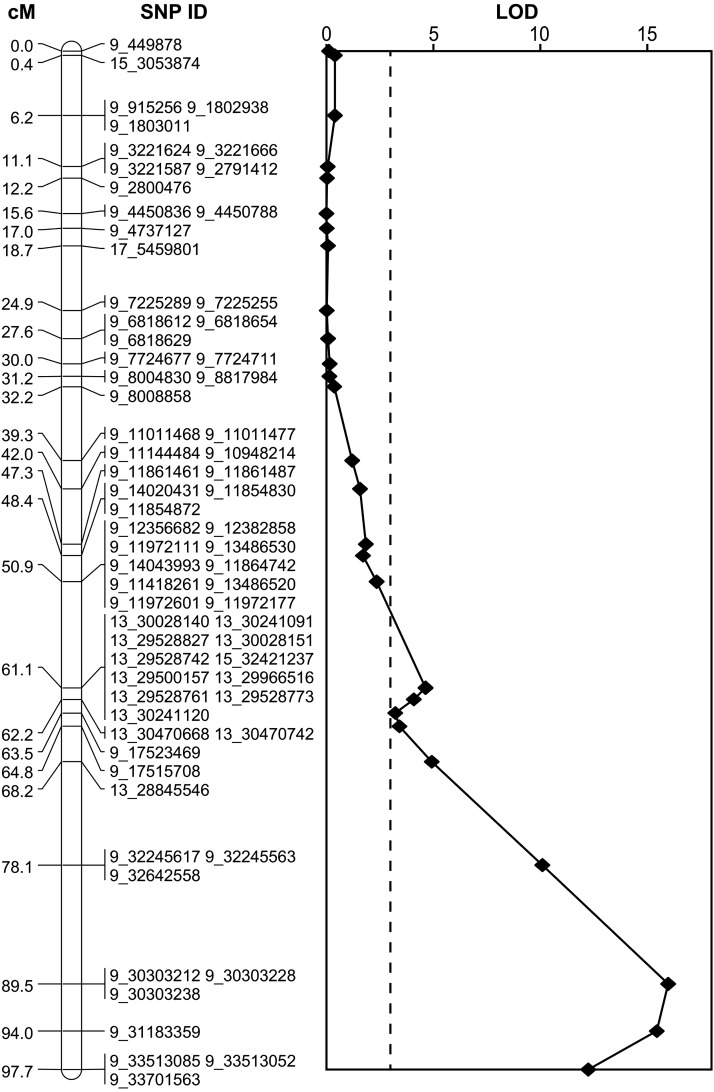
Figure 4.
Result of QTL analysis across the linkage group corresponding to chromosome 9 of the apple genome. The left panel indicates the genetic map positions in cM of each of the SNPs or groups of SNPs. Each SNP’s ID indicates its physical position according to the reference genome, i.e., the physical coordinate it was assigned through alignment and SNP calling (e.g., SNP 9_ 449878 mapped to position 449878 on chromosome 9 of the "Golden Delicious" v1.0 reference genome). Note that many SNPs genetically mapping to the linkage group corresponding to chromosome 9 are assigned to other chromosomes according to the reference genome (e.g., SNP 13_30028140). The right panel displays the LOD scores from a QTL analysis for skin color for markers that segregate in the Scarlet Spur genetic background. The horizontal dashed line represents the significance threshold determined by permutation. LOD scores across all linkage groups are shown in Figure S3.

