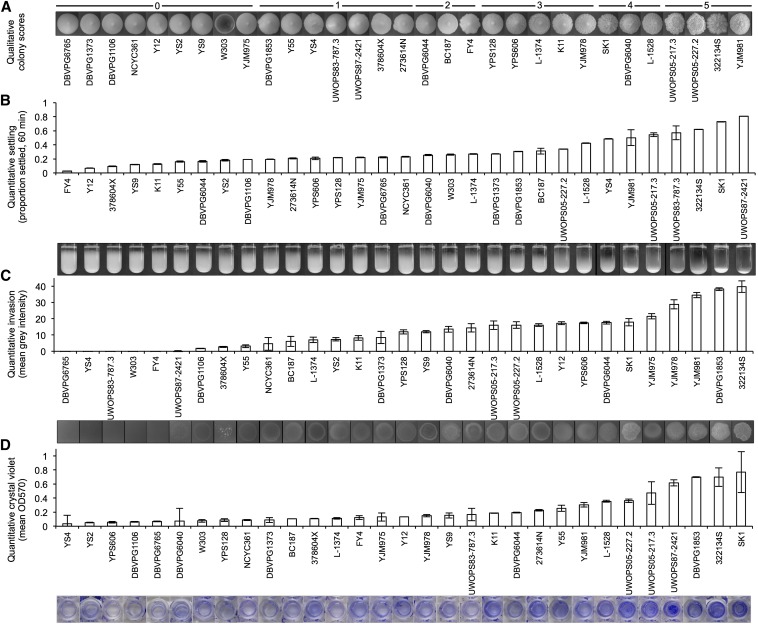
Figure 2.
Quantitative measures of biofilm-related phenotypes accurately represent qualitative data. Haploid strains on the x-axis are ranked by increasing phenotypic strength. For procedural details of each method of quantification, see Materials and Methods. (A) Qualitative colony classifications at day 13 of growth, from (0) weak to (5) very strong. (B) Quantitative flocculation measured as the percent of culture settled at 60 min. Average of three measurements per image. (C) Quantitative invasion data measured as the mean gray intensity of the invaded spot. Average of three technical replicates. (D) Quantitative crystal violet data measured as OD570 absorbance of crystal violet–stained biofilms. Average of two technical replicates; exceptions are DBVPG6040, YS4 with one measurement only for crystal violet.

