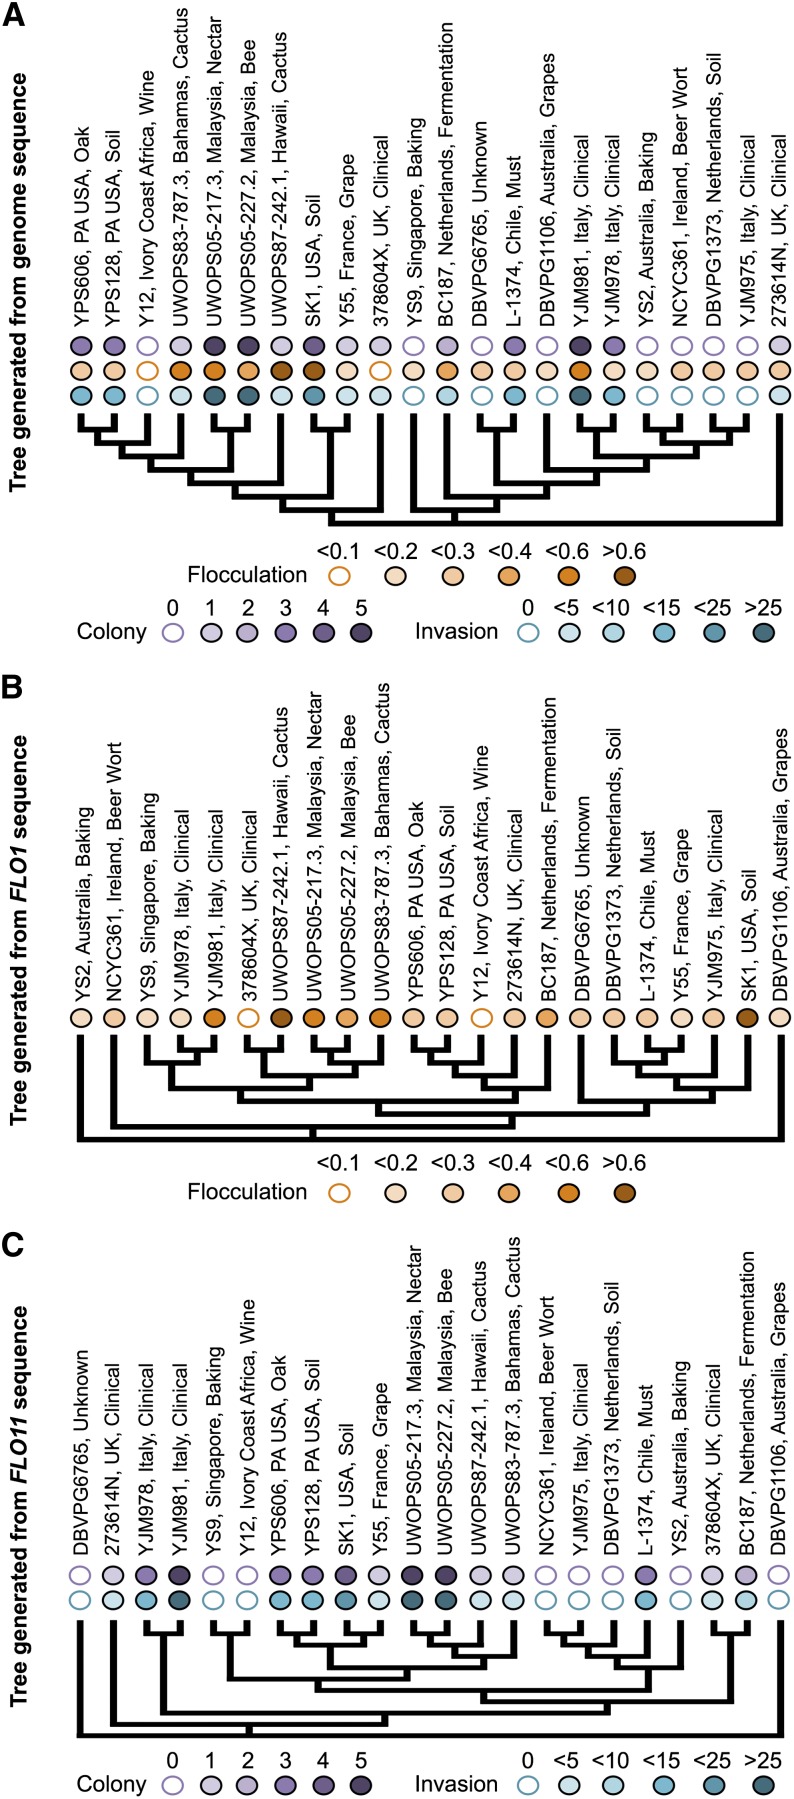
Figure 4.
Genetic similarity is not the only predictor of phenotype. (A) 22 SGRP strains clustered by genome sequence in the YRC phenome browser (http://www.yeastrc.org/g2p/). Qualitative and quantitative phenotypic data are shown above each branch, with increasing color intensity corresponding to increasing score. Qualitative colony data are scored and colored from intensity 0 to 5. Quantitative data were binned into 5 corresponding color intensities. (B) Tree generated from FLO1 gene sequence. Quantitative flocculation data are shown above each branch. (C) Tree generated from FLO11 gene sequence. Qualitative colony morphology and quantitative invasion data are shown above each branch.

