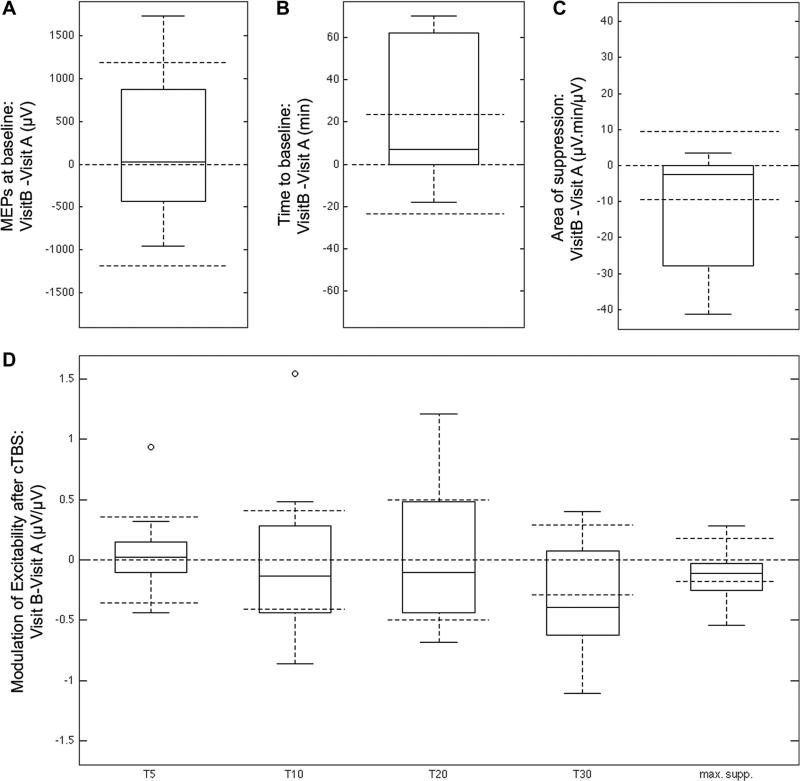
Fig. 2.
Box plots of the individual difference between the two visits for: A. MEP at baseline; B. time to baseline; C. area of suppression; D. modulation at T5, T10, T20 and T30 and maximum suppression. The box horizontal line is the median individual differences between visits; the tops and bottoms of each box are the 25th and 75th percentiles; the whiskers extend to the further observations beside outliers. Open dots are outliers, more than 1.5 times the interquartile range (i.e. distance top–bottom) away from the top or bottom of the box. Dashed horizontal lines are zero, plus and minus the inter-individual variability (averaged between the two visits).

