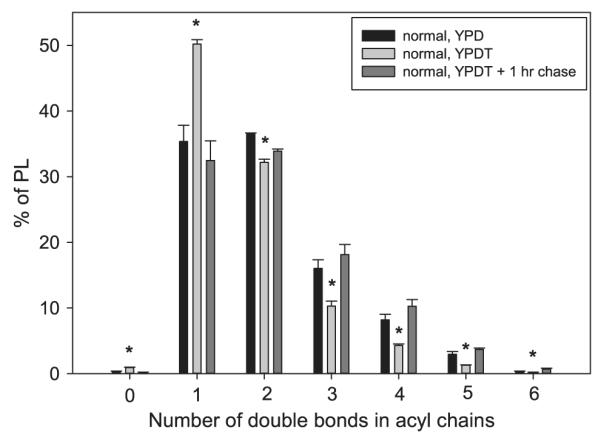
Fig. 7.

Phospholipid composition at the three extremes of the pulse–chase assay. Dense cultures of normal strain SN152 were diluted to 5 × 10⁵ cells/ml in YPD and assayed for PL remodeling as described in Fig. 6 and Materials and methods. To show the efficacy of the pulse and the chase, the YPD (no pulse; black bars), YPDT — 0 h chase (pulse; light gray), and YPDT — 1 h chase (pulse and longest chase; dark gray) data are shown. Lipids were extracted from the yeast and PL composition determined by ESI-MS2. PL species were grouped based on the number of double bonds in the acyl chains, regardless of head group, and expressed as percent of all PL. Data represent means ± standard deviation (n = 3). Asterisks indicate significant statistical difference between the YPD and YPDT — 0 h chase (p < 0.05).
