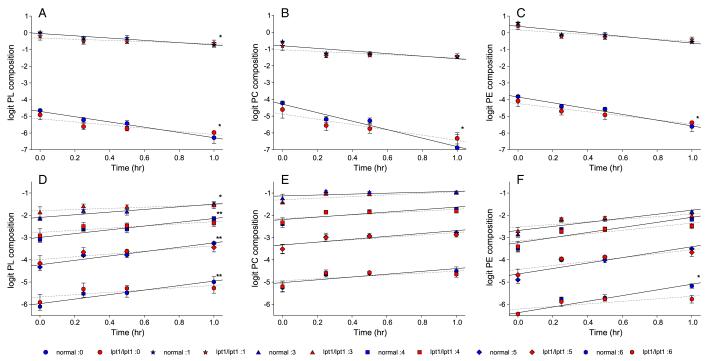
Fig. 8.
Phospholipid remodeling during the chase in normal and lpt1Δ/lpt1Δ strains. Cultures of normal strain SN152 and lpt1Δ/lpt1Δ strains (OMY15, 20) were assayed for PL remodeling as described in Figs.6, 7 and Materials and methods. Lipids were extracted and PL composition determined by ESI-MS2. PL species were grouped based on the number of double bonds in the acyl chains. Percent compositions were transformed to logit values (logit = ln (p/(1 – p)). Number of double bonds (symbol): 0 (circle), 1 (star), 3 (triangle), 4 (square), 5 (diamond), and 6 (hexagon). Blue symbols are SN152 and red symbols are OMY 15, 20 data, representing means ± standard deviation (n = 3). Regression analysis was performed to compare the slopes of normal (solid lines) vs. lpt1Δ/lpt1Δ data (dashed lines) *p < 0.05; **p < 0.10. (A–C) PL, PC, and PE species, respectively, decreasing during the chase. (D–F) PL, PC, and PE species, respectively, increasing during the chase.

