Figure 2.

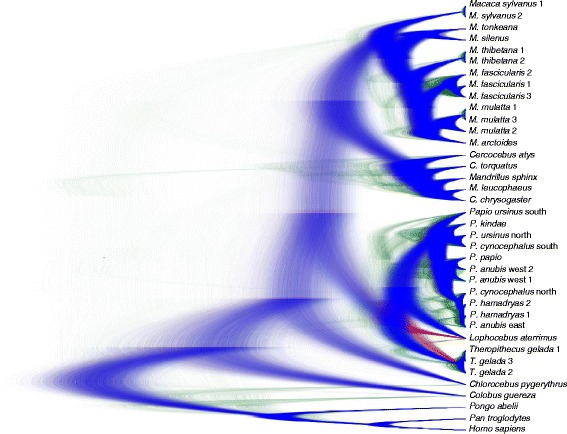
Densitree showing the posterior probability of 25,000 trees taken from the Bayesian divergence age analysis in BEAST. Blue represents the most frequent tree topology, red represents the second and green the third most frequent topology.

Densitree showing the posterior probability of 25,000 trees taken from the Bayesian divergence age analysis in BEAST. Blue represents the most frequent tree topology, red represents the second and green the third most frequent topology.