
Figure 1. Association results from a GWAS of never-smoking women in Asia.
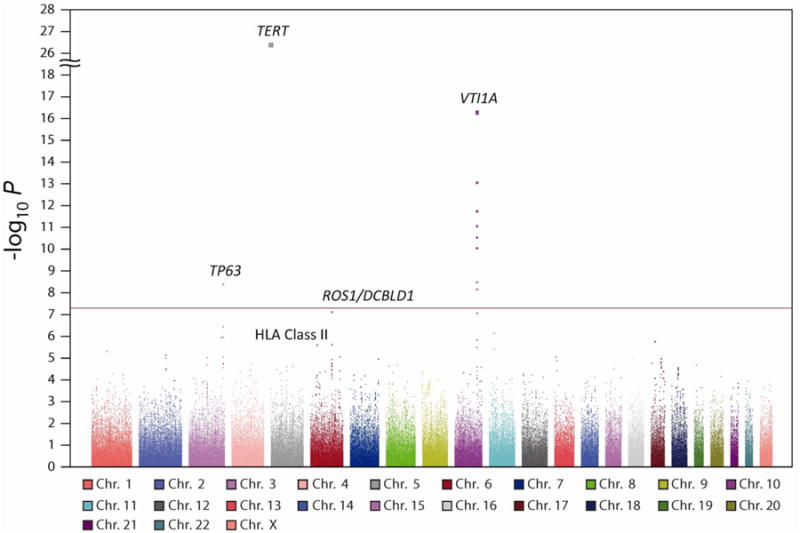
Manhattan plot based on P values derived from 1-degree-of-freedom tests of genotype trend effect in an unconditional logistic regression analysis adjusted for study, age and three eigenvectors in a GWAS of lung cancer in never-smoking Asian females, including 5,510 lung cancer cases and 4,544 controls. The x axis represents chromosomal location, and the y axis shows P values on a negative logarithmic scale. The red horizontal line represents the genome-wide significance threshold of P = 5 × 10⁻⁸. Labeled are two previously associated loci (TERT at 5p15.33 and TP63 at 3q28) together with three newly identified loci (VTI1A on chromosome 10 and ROS1-DCBLD1 and the HLA Class II region on chromosome 6).