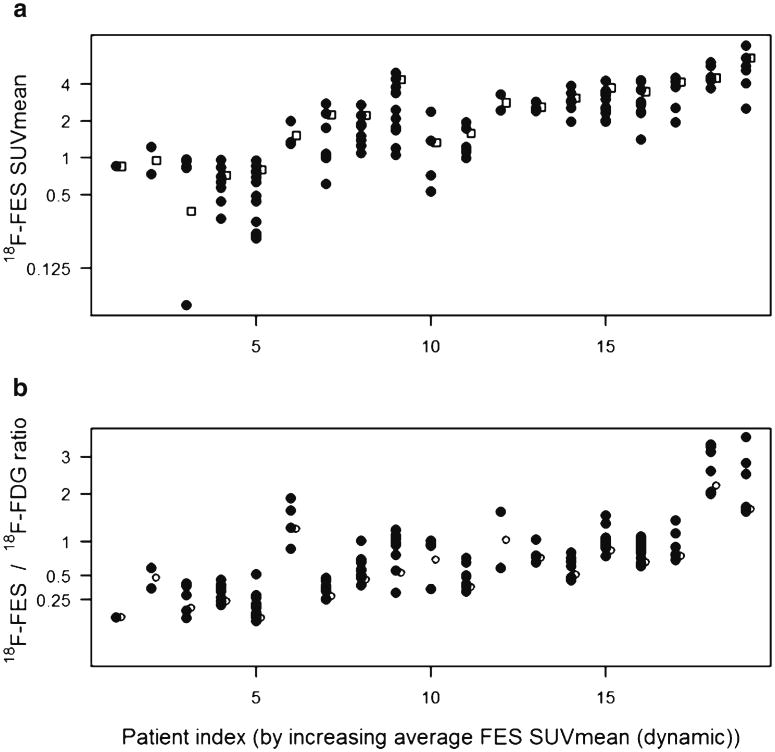
Fig. 2.
Alternative analysis methods for FES uptake. Panel a shows SUVmean for all lesions in the torso survey (black circles). Also displayed is the average for up to three lesions with highest FDG SUVmax (hollow squares). Panel b shows the FES/FDG ratio for all lesions in the torso survey, as well as the average for up to three lesions. For consistency, the horizontal axis for both panels is arranged by increasing average FES SUVmean (from the dynamic FOV). The different patient-level summaries follow different rank orders. For example, patient 6-018 (index #6 on the horizontal axis) had lesions with low FDG uptake, so the FES/FDG ratio was high relative to FES uptake.

