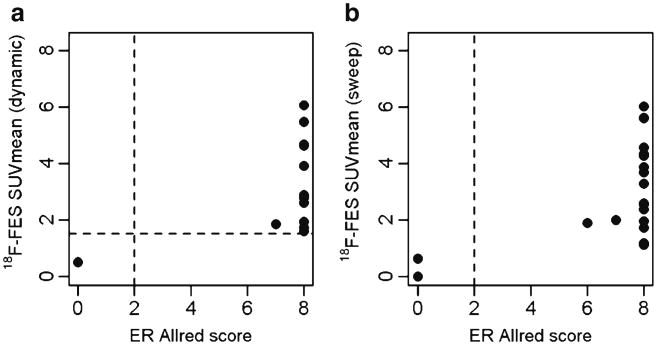
Fig. 3.
Association between quantitative FES uptake measures and ER expression in biopsy tissue. a The relationship between FES SUVmean (dynamic scan) mean and Allred scored levels of ER expression, for 13 lesions in 11 patients. The vertical dotted lines represent the division of a positive or negative Allred score. The horizontal dotted line depicts the previously established cutpoint of 1.5. Imaging and tissue assay classifications agree in all cases. b The relationship between FES SUVmean (torso scan) and ER expression, for 20 lesions in 13 patients. Imaging and tissue assay classifications appear to agree, although two lesions have low SUVmean scores in contrast to the Allred score of 8 for the biopsied material. Both discrepancies were from a single patient's axillary nodes with SUVmean of 1.1–1.2, in contrast to biopsy results (Allred 8 from a core biopsy, 11-019).

