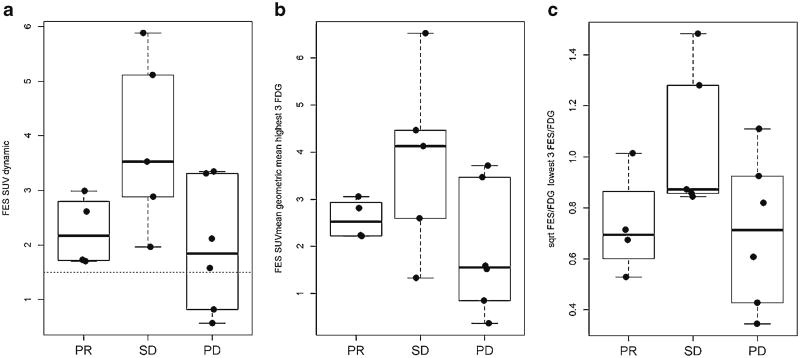
Fig. 4.
Association between three patient-level quantitative measures of FES uptake and clinical response. a shows the distribution of response compared to FES SUVmean (dynamic scan). b The response distribution of FES SUVmean, for the three lesions in the torso sweep with highest FDG SUVmax. c The response distribution compared to the average FES/FDG ratio, for the three lesions in the torso sweep with lowest FES/FDG ratio.

