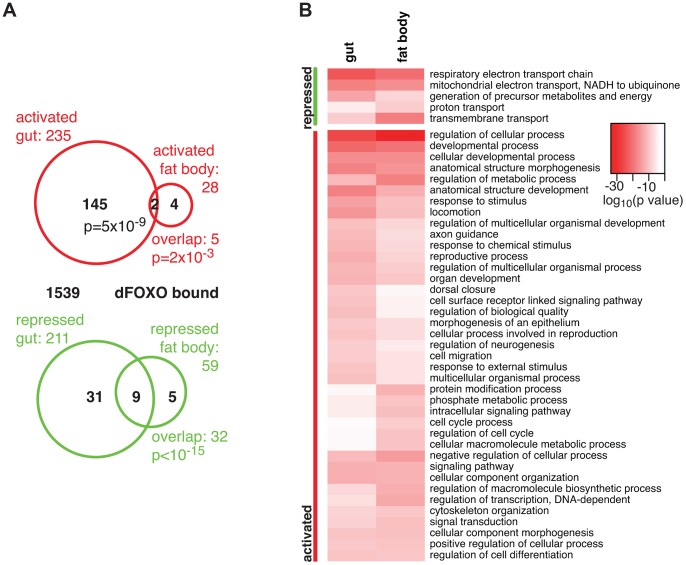
Figure 1. dFOXO targets in the adult gut and fat body.
A Proportional Venn diagram showing the sets of genes that were differentially regulated by dfoxo induction in the gut or the fat body. The number of genes that were bound by GFP-dFOXO within each differentially expressed-gene set are given in black. p values for significant set overlaps are indicated. B Biological process GO categories differentially regulated (p<10−10) in the fat body or gut upon induction of dfoxo as determined by Catmap analysis. Any redundant categories (overlap by more than 75%) were removed, retaining the most specific category. The full list is given in Dataset S1. The intensity of red shows the log10-transformed p-value associated with differential regulation for each category.

