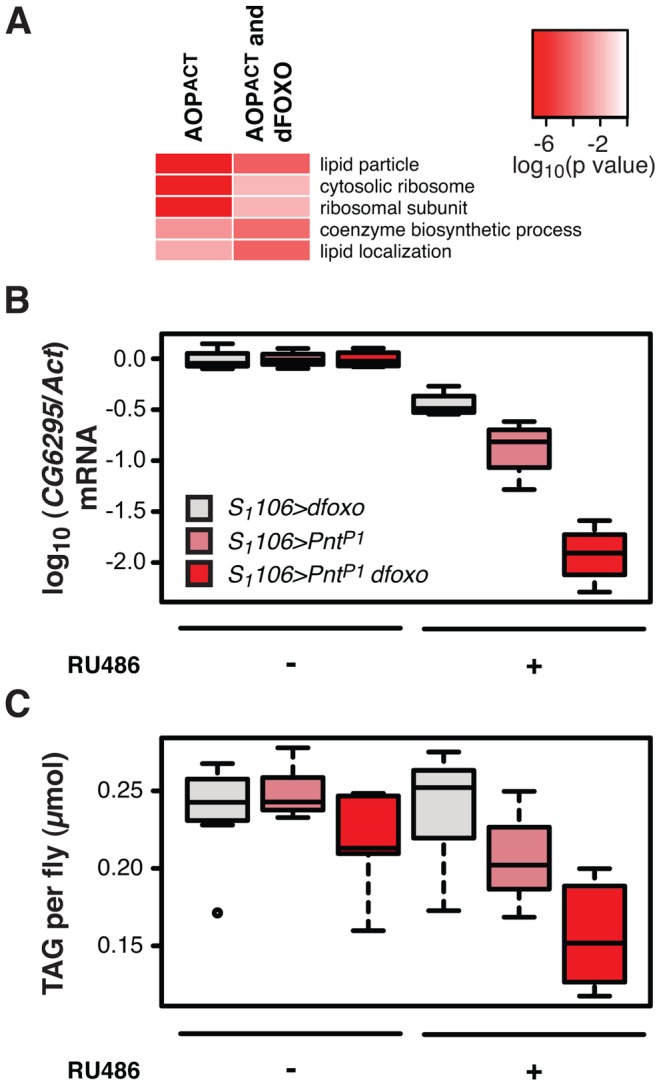
Figure 6. dfoxo and Pnt act synergistically on lipid metabolism.

A Top three most significantly enriched GO categories within genes bound by FLAG-AOPACT alone or FLAG-AOPACT and dFOXO, as determined by EASE analysis. The intensity of red indicates log-10 derived p value associated with the enrichment. The complete GO analysis is given in Dataset S1. B CG6296 mRNA was quantified relative to Act by qPCR in the females of the indicated genotypes, induced or not with RU486. Boxplots show log-10 derived relative expression with − RU486 values set to zero. Data were analysed with a linear model and the effects of RU486, genotype and their interaction were significant (n = 4, p<10−4), with S1106>dfoxo PntP1 + RU486 condition being different to all others (t-test , p<10−4). C The levels of TAG were quantified under the same conditions as in B. Data were analysed with a linear model and the effects of RU486 (p = 2×10⁻⁴), genotype (p<10−4) and their interaction (p = 0.01) were significant (n = 8, where 10 measurements were made and the lowest and highest measurement removed from each group). The S1106>dfoxo PntP1 + RU486 condition was different from all others (t-test , p<0.05). The genotypes are denoted with the same colours in B and C, with the legend given in B.
