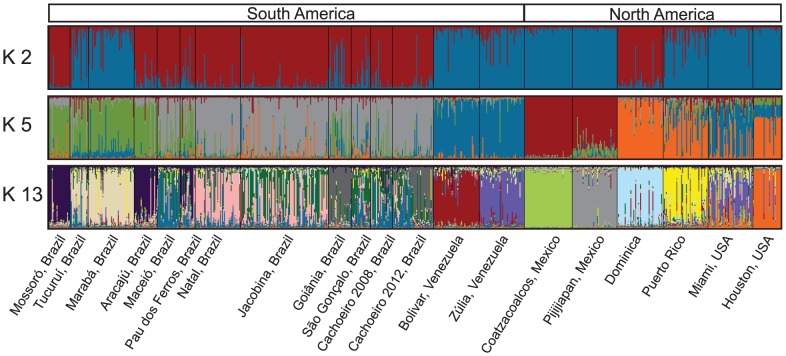
Figure 2. STRUCTURE bar plots for all Ae. aegypti populations studied.
Individuals are represented by vertical bars along the plot. The height of each color represents the probability of assignment to a specific cluster. The black lines within the plots indicate population limits. Subdivision of all the individuals into K = 2 clusters, subdivision into K = 5 clusters, and into K-13 clusters. Legends below and above apply to all three K plots.

