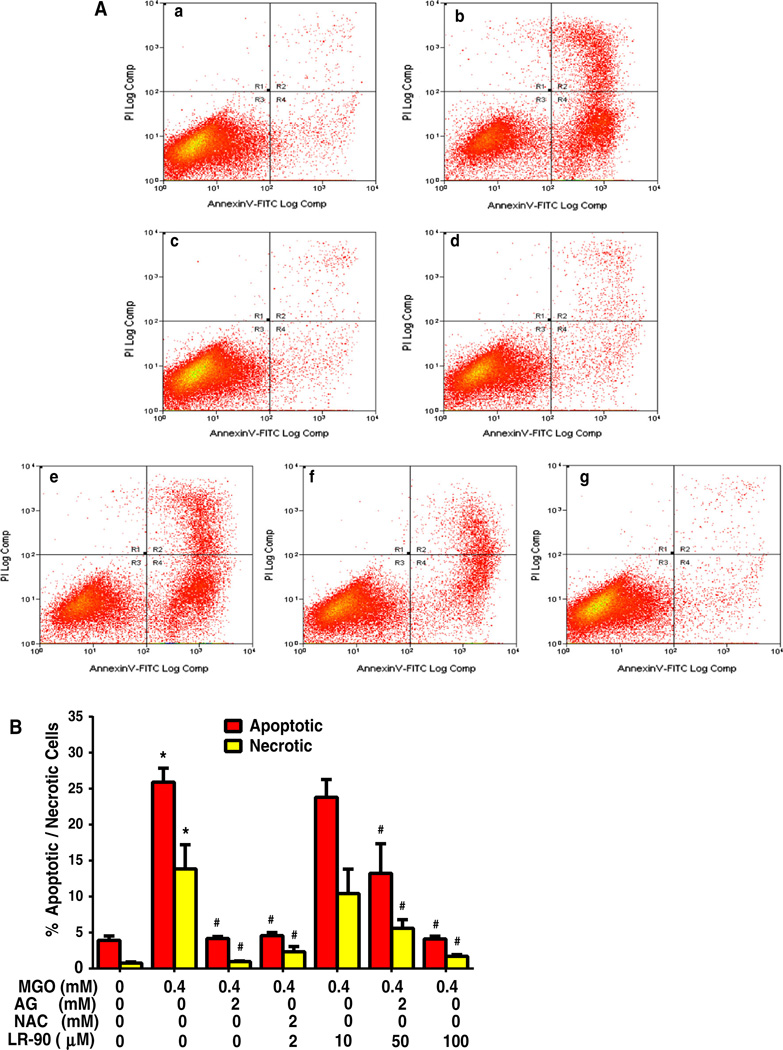
Fig. 2.
Flow cytometry analyses on the effect of LR-90 on MGO-induced apoptosis in HUVECs a Representative cytograms of Annexin V-FITC binding and PI uptake of MGO-stimulated HUVECs. Cells were pretreated with test compounds for 1 h then co-incubated with 0.4 mM MGO. After 24 h, cells were harvested and analyzed by flow cytometry. R1 = PI positive cells (necrotic); R2 = annexin V-FITC positive and PI positive cells (late apoptotic/ necrotic); R3 = annexin V-FITC negative and PI negative cells (normal viable cells); R4 = annexin V-FITC-positive and PI-negative cells (early apoptosis), a vehicle control, b MGO, c MGO + AG (2 mM), d MGO + NAC (2 mM), e MGO + LR-90 (10 µM), f MGO + LR-90 (50 µM), g MGO + LR-90 (100 µM). b Mean percentage of cells in early apoptosis or late apoptosis/necrosis as analyzed by flow cytometry. Data on graph were from three independent experiments (n = 6) and were analyzed by ANOVA followed by Bonferroni’s post hoc test (*p < 0.05 vs. vehicle control and # p < 0.05 vs. 0.4 mM MGO treatment only)

