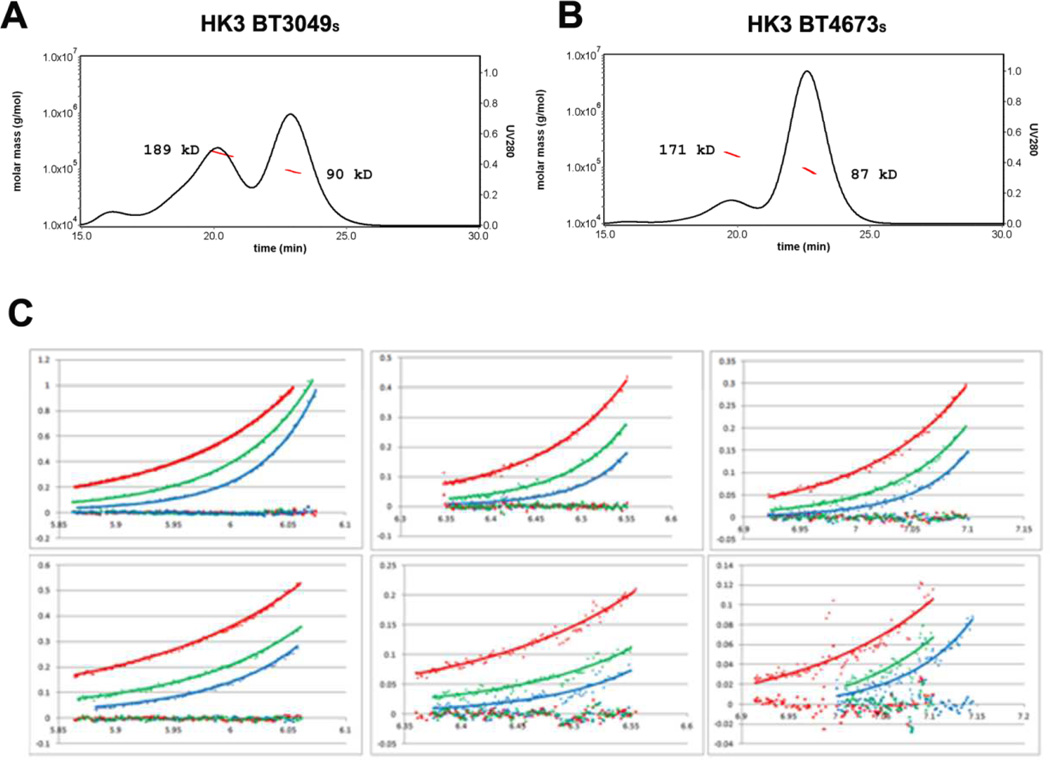
Figure 4. Solution analyses of dimerization by HK3 sensor proteins.
(A, B) Dimerization analysis by SEC coupled with MALS for HK3 BT3049S and HK3BT4673S, respectively. Continuous black lines show the ultraviolet absorption at 280 nm and the red dotted lines show the molecular weights calculated from MALS. Both pictures were made by Astra V (Wyatt). Data were measured within 24 hours of purification.
(C) Analytical ultracentrifugation data and fittings for BT4673S (upper panels) and BT3049S (lower panels), showing measurements made at 2.00, 1.33 and 0.67 mg/mL in panels at left, middle and right, respectively. The colored diamonds represent measured absorbance (280 nm) at equilibrium after runs at 13000 (blue), 11000 (green), and 9000 (red) rpm. The colored squares represent the residues between measured absorbance (280 nm) and fitted data at 13000 (blue), 11000 (green), and 9000 (red) rpm, all of which are near baseline. Data were measured within three days of purification.

