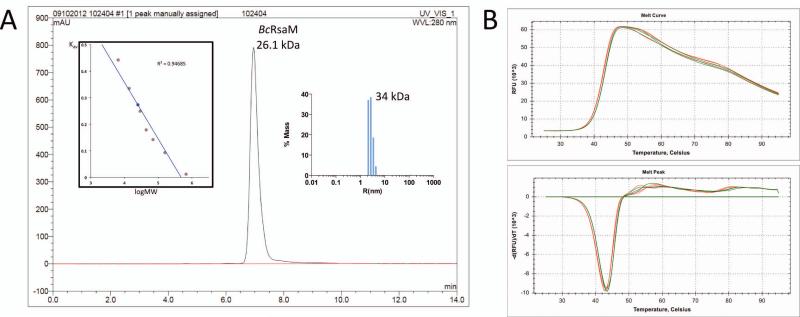
Fig. 3.
BcRsaM characterization. A). Molecular weight determination of BcRsaM using size exclusion chromatography and dynamic light scattering. The absorbance at 280 nm is plotted in absorbance units (AU) versus retention time in min. Left insert is a plot of Kav coefficient versus logarithm of molecular weight (red circles correspond to standard proteins: (1) aprotinin (6.5 kDa), (2) ribonuclease A (13.7 kDa), (3) carbonic anhydrase (29 kDa), (4) ovalbumin (44 kDa), (5) conalbumin (75 kDa), (6) aldolase (158 kDa), and (7) thyroglobulin (669 kDa); blue circle corresponds to BcRsaM (26.1 kDa). A clear peak is observed for the BcRsaM dimer, no other species were detected. Right panel shows DLS results representing particle size distribution for BcRsaM. B). DSF data for BcRsaM alone (green) and in the presence of OHL (red). The upper panel is a melting curve and the lower panel is its first derivative.

