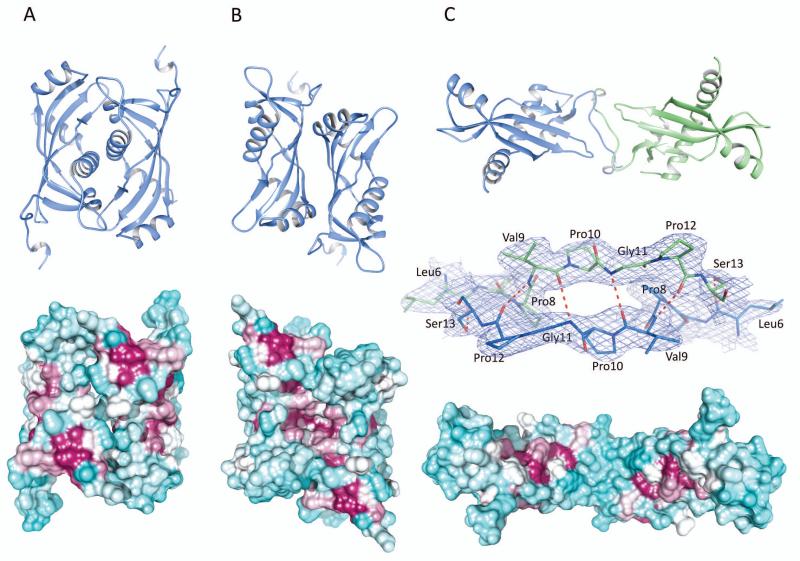
Fig. 4.
Potential dimers of BcRsaM. In the cartoon models (top), chains are colored according to crystallographic monomers involved in the dimer, with molecule A (or its crystallographic copy) shown in blue and molecule B shown in green. The molecular surfaces (bottom) are colored according to sequence conservation with maroon indicating conserved residues and cyan showing non-conserved ones. Sequence conservation calculation was done in Chimera [61] based on 120 sequences identified in three iterations of PSI-BLAST at NCBI and aligned in the Muscle program [59]. The molecules are oriented to present their more conserved side. For panel C, the middle picture presents the dimer interface shown in 2DFo-mFc electron density map contoured at 1σ level. A). Face-to-face dimer (D1(A)). B). Back-to-back dimer (D2(A)). C). Extended dimer (D3(AB)).

