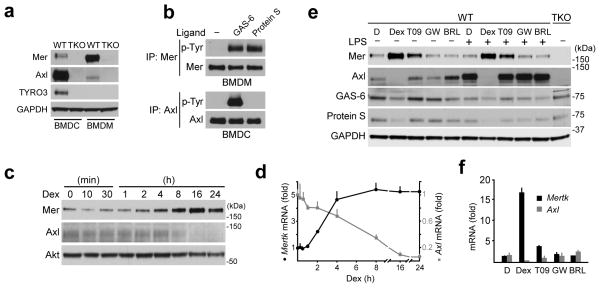
Fig. 1. Differential expression and activation of Axl and Mer.
(a) Immunoblot showing TAM receptor expression and antibody specificity in BMDC and BMDM cultures from WT and TAM TKO mice. The exposure of the Axl and Mer immunoblots in this panel is longer than in subsequent figures to visualize the very low expression of Mer in BMDCs and Axl in BMDMs. Representative of two independent experiments. Axl mRNA copy number (per ng of total RNA ± s.d.) was 29±4 and 28±9 in BMDC and BMDM cultures, respectively, suggesting that most of the difference between these cells is post-transcriptional; whereas for Mer mRNA, these numbers were 3±1 and 37±6 in BMDC and BMDM cultures, respectively.
(b) BMDM and BMDC cultures were stimulated with 10 nM GAS-6 or 25 nM Protein S for 10 min and receptor activation was assayed by immunoprecipitation and immunoblotting. Representative of three independent experiments.
(c,d) Time course of Mer and Axl protein (c) and mRNA (d) in BMDM cultures upon 0.1 μM Dex stimulation assayed by immunoblotting (c) or RT-qPCR (d). (c) – representative of two independent experiments; (d) – fold of change normalized to Hprt mRNA. Average of two independent experiments, each done in technical duplicates, graphed as mean ± s.d.
(e,f) Expression of Mer and Axl protein (e - immunoblot) and mRNA (f - RT-qPCR) in BMDM cultures upon 24 h stimulation with nuclear receptor agonists: DMSO (D), 1 μM Dex (Dex), 1 μM T0901317 (T09), 0.2 μM GW501516 (GW), or 1 μM BRL49653 (BRL). 30 ng/ml LPS was added where indicated 8 h before lysis. (e) – representative of two independent experiments; (f) – fold of change relative to Hprt mRNA. Average of two independent experiments, each done in technical duplicates, graphed as mean ± s.d.

