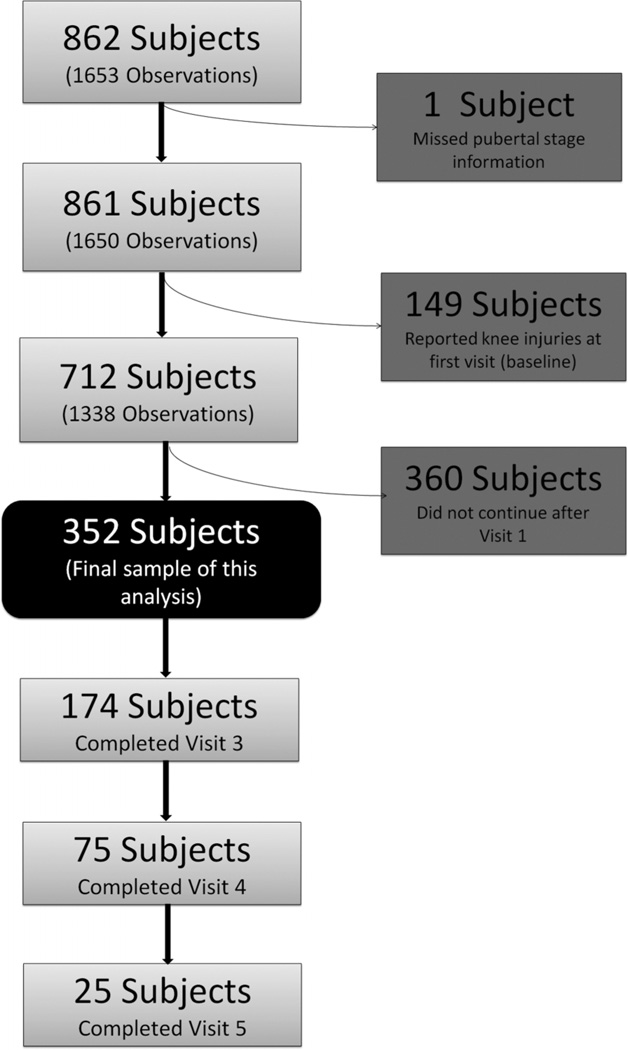
Figure 1.
Flow chart which provides a graphical depiction of the study population as a whole, and how the final sample of 352 participants was identified for the study analysis. Note that the number of participants and the number of observations did not decrease the same amount as each participant could have had 1, 2 or 3 visits in the sample.

