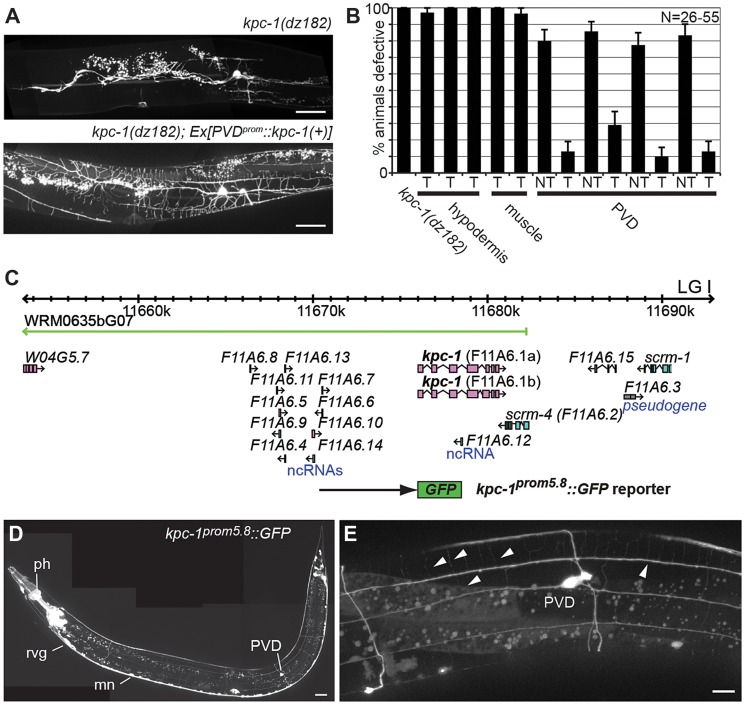
Figure 2. KPC-1 functions in PVD to shape dendritic arbors.
A Epifluorescence micrographs of kpc-1(dz182) mutant animals and transgenically rescued kpc-1(dz182) animals. Scale bars indicate 50 µm. B Quantification of transgenic rescue. Transgenic (T) and nontransgenic (NT) siblings were quantified in kpc-1 mutant animals in which a kpc-1 wild type DNA was driven from a hypodermal (dpy-7prom) [31], muscle (myo-3prom) [32] or PVD specific promoter (ser-2prom3) [9]. Defective animals were defined as in Figure 1I. C Schematic of the kpc-1 locus on linkage group (LG) I. The extent of the rescuing fosmid WRM0635bG07 is indicated in green as is the transcriptional kpc-1::GFP reporter that contains 5.8 kb of regulatory sequence upstream of the ATG (kpc-1prom5.8::GFP). A transcriptional reporter containing 2.8 kb of regulatory sequence (kpc-1prom2.8::GFP) was not expressed in PVD suggesting that regulatory elements for PVD expression reside between −2.8 kb and −5.8 kb (Figure S4). D Composite epifluorescent micrograph of an adult transgenic animal carrying the kpc-1prom5.8::GFP transgene. Expression is seen in the pharynx (ph) and the nervous system, e.g. the retrovesicular ganglion (rvg), ventral cord motor neurons (mn) and in PVD mechanosensory neurons. In addition, expression is seen in vulval epithelial tissues as well as the spermatheca (not shown here). A scale bar indicates 30 µm. E Higher magnification epifluorescent micrograph of an adult transgenic animal carrying the kpc-1prom5.8::GFP transgene. Expression is seen in PVD and its dendritic tree (arrowheads). A scale bar indicates 10 µm.

