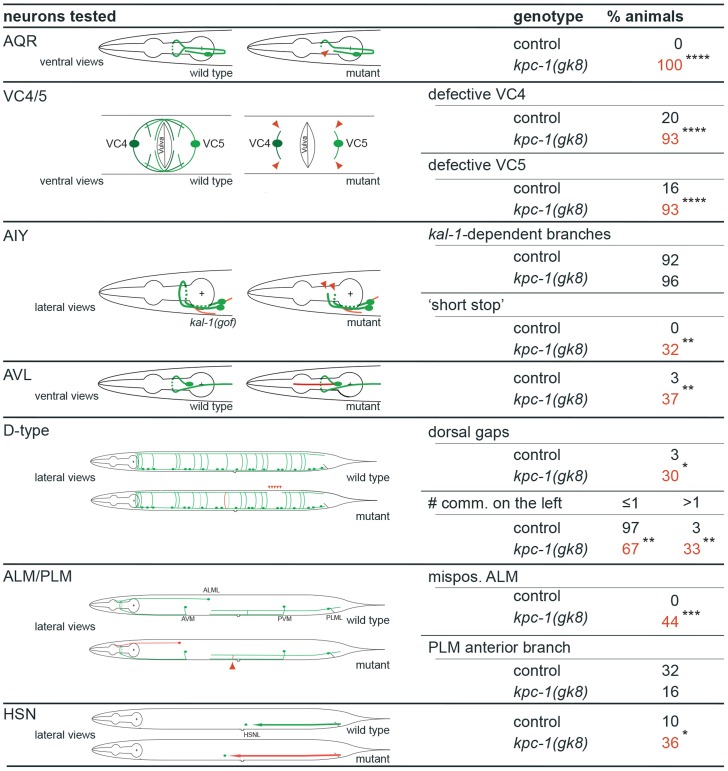
Figure 3. kpc-1 displays defects in neurite branching, extension and cell positioning of certain sensory neurons, interneurons and motoneurons.
Summary of neuronal defects observed in several classes of neurons. Schematics of normal neuronal morphology is shown and contrasted with abnormal neuronal morphology indicated in red or with red arrowheads. N = 30 in all cases except AIY and ALM (N = 25). Statistical significance was calculated using Fisher's exact test and is indicated (*, P≤0.05; **, P≤0.01; ***, P≤0.001; ****, P≤0.0001, ns: not significant (P>0.05)).

