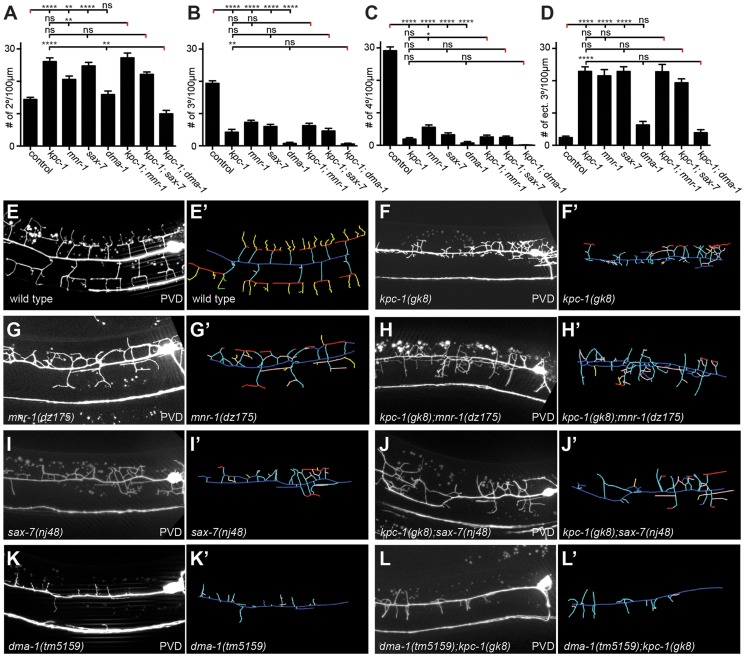
Figure 4. kpc-1 acts in a genetic pathway with mnr-1/menorin, sax-7/L1CAM, and the leucine rich repeat (LRR) transmembrane receptor dma-1.
A–D Quantification of branch numbers in kpc-1(gk8), mnr-1(dz175), sax-7(nj48), and dma-1(tm5159) single and double mutant animals. Data are represented as mean +/− SEM of the number of branches found in the 100 µm segment immediately anterior to PVD cell body. Statistical comparisons were performed using one-sided ANOVA with the Tukey correction and statistical significance is indicated (*, P≤0.05; **, P≤0.01; ***, P≤0.001; ****, P≤0.0001, ns: not significant (P>0.05)). N = 21 animals (1371 dendritic branches) of wild type control; N = 21 animals (1158 dendritic branches) of kpc-1(gk8); N = 21 animals (1154 dendritic branches) of mnr-1(dz175); N = 22 animals (1251 dendritic branches) of sax-7(nj48), N = 22 animals (520 dendritic branches) of dma-1(tm5159), N = 19 animals (1119 dendritic branches) of kpc-1(gk8); mnr-1(dz175), N = 25 animals (1213 dendritic branches) of kpc-1(gk8); sax-7(nj48), N = 22 animals (319 dendritic branches) of kpc-1(gk8); dma-1(tm5159). Data for wild type control and kpc-1 are identical to Figure 1 and shown for comparison only. E–L maximum intensity projections of representative L3 larval animals of the genetic backgrounds as indicated, paired with schematics of the respective tracings (E′–L′). Traces were color coded as follows: dark blue: 1°, cyan: 2°, red: 3°, yellow: 4°, rose: ectopic 3°, dark blue: mispositioned 3° (combined with ectopic 3° for quantification purposes), green: 5°.

