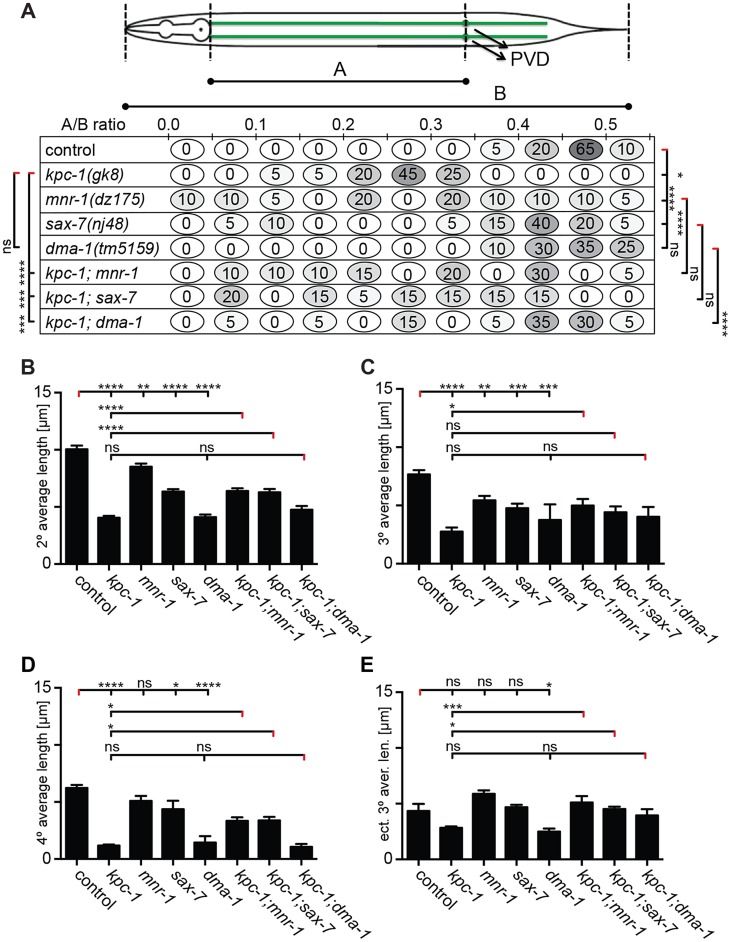
Figure 5. kpc-1 controls dendrite branch extension.
A Quantification of primary branch length, expressed as a ratio of A/B to normalize for animal size (as indicated in schematic) is shown for the genotypes indicated. Percentage of animals falling within a bin (of A/B ratio) is given (illustrated with the corresponding shade of grey). Statistical significance was calculated using the F test to compare variances (*, P≤0.05; **, P≤0.01; ***, P≤0.001; ****, P≤0.0001, ns: not significant (P>0.05). B–E Quantification of average branch length in kpc-1(gk8), mnr-1(dz175), sax-7(nj48), and dma-1(tm5159) single and double mutant animals. Data are represented as mean +/− SEM. Statistical comparisons were performed using one-sided ANOVA with the Tukey correction. Statistical significance is indicated (*, P≤0.05; **, P≤0.01; ***, P≤0.001; ****, P≤0.0001, ns: not significant (P>0.05)). Number of animals and dendrites scored as in legend to Figure 4.

