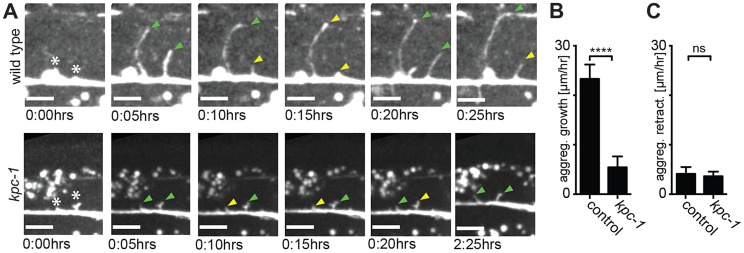
Figure 6. Dendrites in kpc-1 display decreased speed of growth.
A Time-lapse still images of a wild type (upper panel) and a kpc-1(gk8) mutant animal (lower panel), indicating the times after imaging was begun at the L3 stage. Asterisks mark the place of budding secondary dendrites being measured. Green arrowhead: secondary dendrites in active dendritic growth. Yellow arrowhead: secondary dendrites undergoing retraction. Note the limited growth of dendrites in kpc-1 mutant animals even 2:25 hours after initiation. B–C Quantification of aggregate growth (B) and aggregate retraction speed (C) per hour in secondary branches from time lapse movies of the genotypes indicated. Data are represented as mean +/− SEM. Statistical comparisons were performed using the Student t-test and statistical significance indicated (***, P≤0.001; ns, not significant (P>0.05)).

