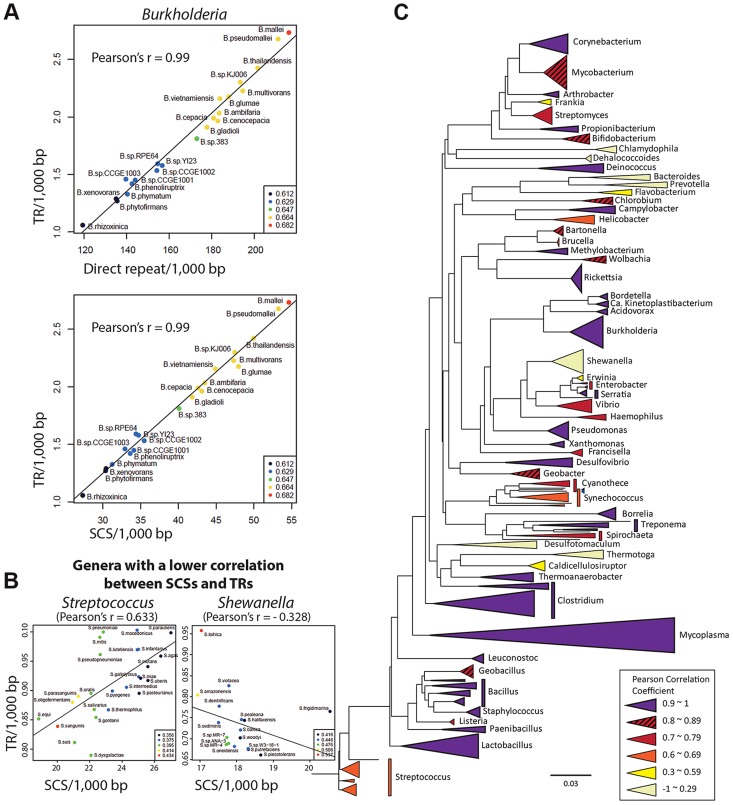
Figure 6. Genome-level correlation analysis between TRs and SCSs or direct repeats.
A. TRs-direct repeats and TRs-SCSs correlations in Burkholderia. A high Pearson correlation coefficient of 0.99 was measured in both analyses, suggesting that the formation of TRs are largely attributable to both direct repeats and SCSs in Burkholderia. B. SCSs-TRs correlations of two genera representing mid and low levels (Streptococcus and Shewanella, respectively). The entire set of the data is shown in Figure S3. C. The SCSs-TRs correlation profile in the bacterial phylogenetic tree. Bacterial genera are color-coded based on the levels of the Pearson correlation coefficients.

