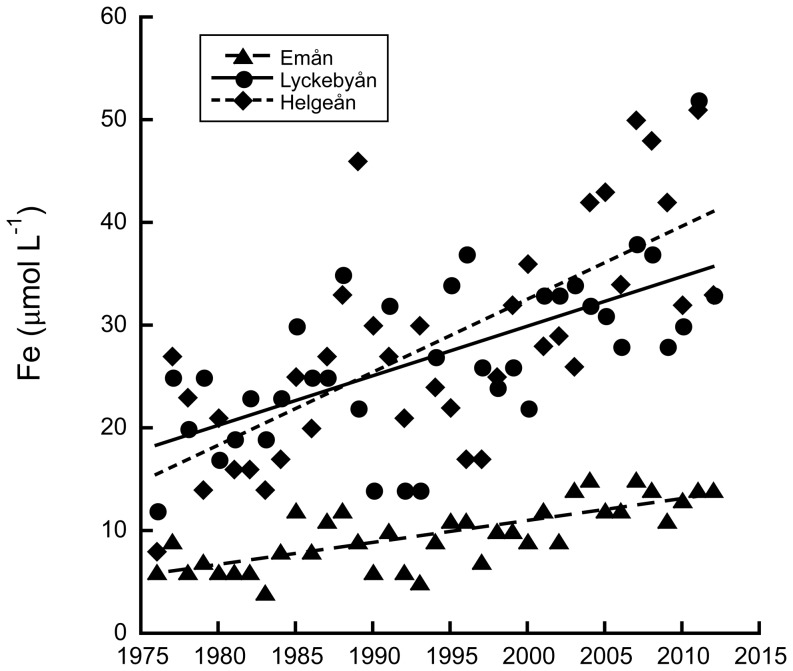
Figure 1. Yearly mean iron concentrations in the river mouths of three different rivers from 1976–2012.
Lines denote the linear regression equations, which were µmol Fe L−1 = 0.212× year – 413.2 (r2 = 0.56, p<0.001); µmol Fe L−1 = 0.477× year – 924.0 (r2 = 0.40, p<0.001); and 0.716× year – 1398.4 (r2 = 0.51, p<0.001) for Emån, Lyckebyån and Helgeån respectively.

