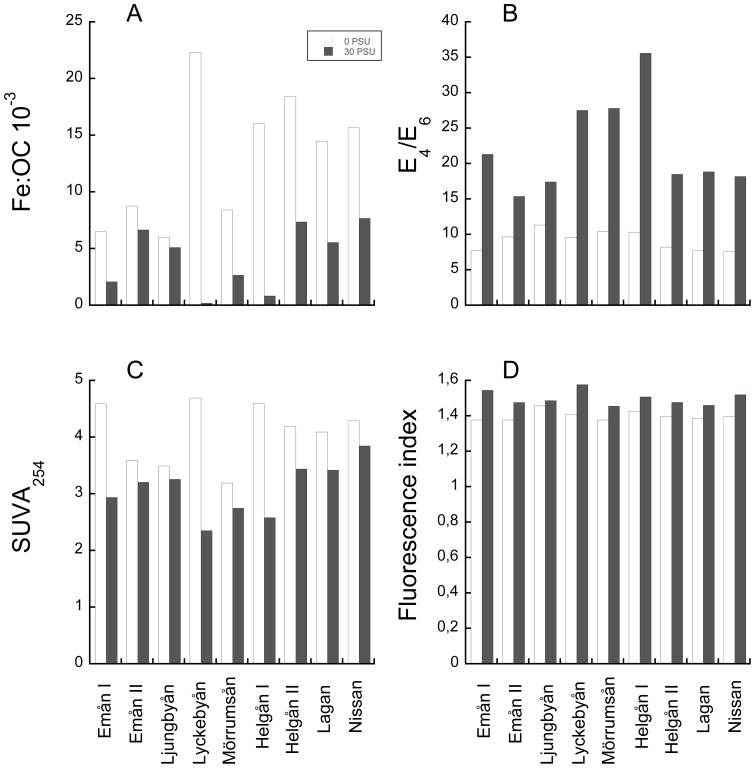
Figure 3. Differences in iron and organic matter in suspension in river waters at 0 and 30 salinity.
A) ratio between iron and organic carbon, B) ratio of absorbance at 465 and 665 nm, C) specific UV absorbance at 254 nm and D) fluorescence index (ratio of emission at 470 and 520 nm and an excitation of 370 nm).

