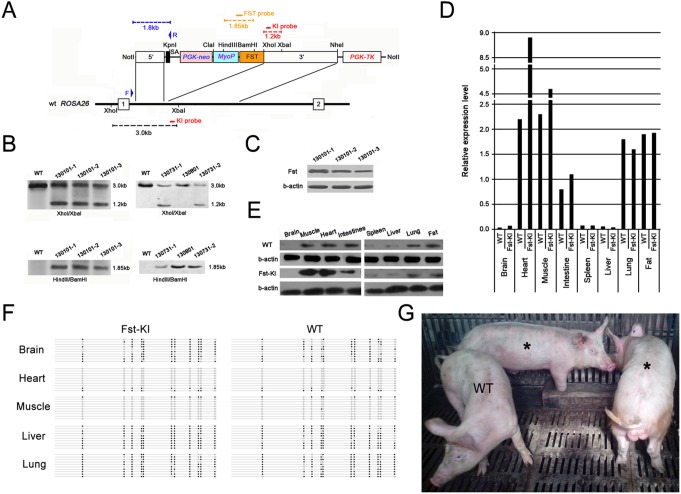
Figure 4. MyoP-Fst targeting in the pRosa26 locus.
(A) Schematic representive of the MyoP-Fst targeting vector and a segment of the pRosa26 locus. SA, splice acceptor. The red and black dashed lines indicate the knockin (1.2 kb) and WT (3.0 kb) band sizes expected after XhoI/XbaI digestion in the Southern blot. The yellow dashed line indicates the Fst band size (1.85 kb) expected after HindIII/BamHI digestion in the Southern blot. The blue dashed line indicates the band size (1.8 kb) in the 5′ arm PCR analysis using F and R primer set. (B) Southern blot of cloned pigs. 5 correctly targeted pigs were confirmed. (C) Fst expression in ear of 3 Fst-KI pigs by Western blot. (D) Fst expression relative to b-actin in various tissues of Fst-KI pig by Q-PCR. (E) Fst expression in various tissues of Fst-KI pig by Western blot. (F) DNA methylation status of MyoP in various tissues of Fst-KI pig. (G) Fst-KI pigs. 130731-1 and -2 are marked with *. WT, wild type.

