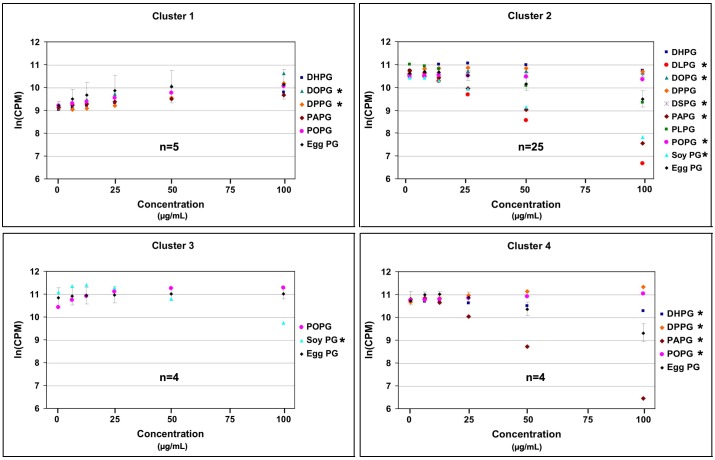
Figure 4. Comparison of Effects of PG Species on Keratinocyte Proliferation.
Based on the regression line of the comparative egg PG data, Cluster 1 represents the experiments with a linear increasing relationship between ln(CPM) and ln(concentration) of egg PG, Cluster 2 represents the experiments with a non-linear decreasing relationship between ln(CPM) and ln(concentration), Cluster 3 represents the experiments with a flat, quadratic relationship between ln(CPM) and ln(concentration), and Cluster 4 represents the experiments with a decreasing step function between ln(CPM) and ln(concentration), respectively. Those PG species exhibiting a statistically significant difference from egg PG (either a greater or lesser effect) are marked by asterisks. The number of different experiments for which the egg PG comparator was performed is indicated.

