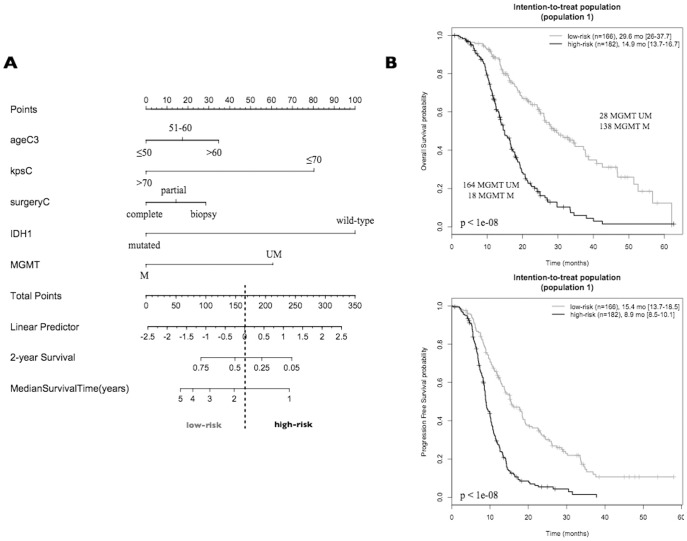
Figure 1. GBM patients assigned to standard treatment (population 1).
(A) Nomogram for predicting median survival, probability of survival at two years, and risk category. The total number of points for each patient is obtained by summing the points for each of the individual factors in the nomogram. The median survival and probability of survival at two years for a given patient are obtained by drawing a vertical line from the “total points” axis down to the outcome axes. The definition of two risk groups (high/low) is based on the value of the linear predictor underlying the nomogram: values greater than or equal to zero were assigned to the high-risk group, and negative values were assigned to the low-risk group. The total point value matching the null value of the linear predictor is 165. Example: a 55-year-old patient with a KPS of 80 and a partly resected/IDH1 wild-type/MGMT-methylated tumor has a total prognostic score of 129 and is predicted to have a median survival of approximately 30 months and a 60% probability of surviving two years. This patient is assigned to the low-risk group. (B) Kaplan-Meier estimation of OS and PFS. M: methylated patients, UM: unmethylated patients, LR: low-risk patients, HR: high-risk patients, mo: month. The difference in survival between groups is reported (log-rank test p-value). The size and the median survival of each group are also specified.

