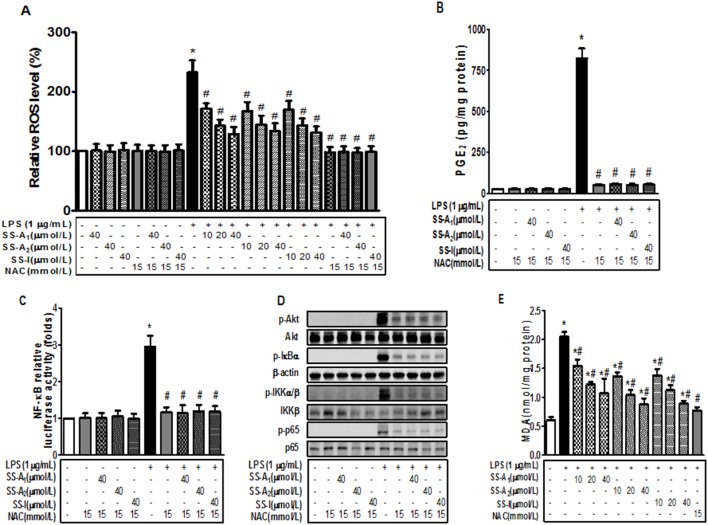
Figure 7. Soyasaponins blunt the LPS-induced ROS production in macrophages.
Macrophages were pre-treated with NAC (15 mmol/L) or/and soyasaponins (A1, A2 or I) for 30 min, and then stimulated with LPS (1 µg/mL) for 16 h as noted. Intracellular ROS level was subsequently quantified by using fluorescent DCF-DA probe and quantified as described in Materials and Methods (A). The level of PGE2 in the media was determined by using an enzyme immunoassay (B). (C) The pNF-kB-Luc reporter plasmid was introduced into macrophages via transient transfection for overnight, and then stimulated for 16 h with 1 µg/mL LPS in the presence of NAC or NAC plus 40 µmol/L of SS (A1, A2 or I) as noted. The level of luciferase activity was determined and presented as the fold of the negative control. (D) Macrophages were pre-treated with NAC alone or NAC plus 40 µmol/L of SS (A1, A2 or I) for 2 h, and then stimulated with LPS (1 µg/mL) for 10 min (for detection of p-IkBα and β-actin), 15 min (for detection of p-IKKα/β, IKKβ, p-p65 and p65) or 30 min (for detection of p-Akt and Akt) as noted. Protein levels were detected by using immunoblotting. β-actin was used as a loading control. (E) Macrophages were pre-treated with NAC (15 mmol/L) or soyasaponin (A1, A2 or I) for 30 min, and then stimulated with LPS (1 µg/mL) for 16 h as noted, followed by measurements of MDA in the whole cell lysates. Results are presented as means ± SD of 3 independent experiments. *: P<0.05 vs control. #: P<0.05 vs LPS alone.

