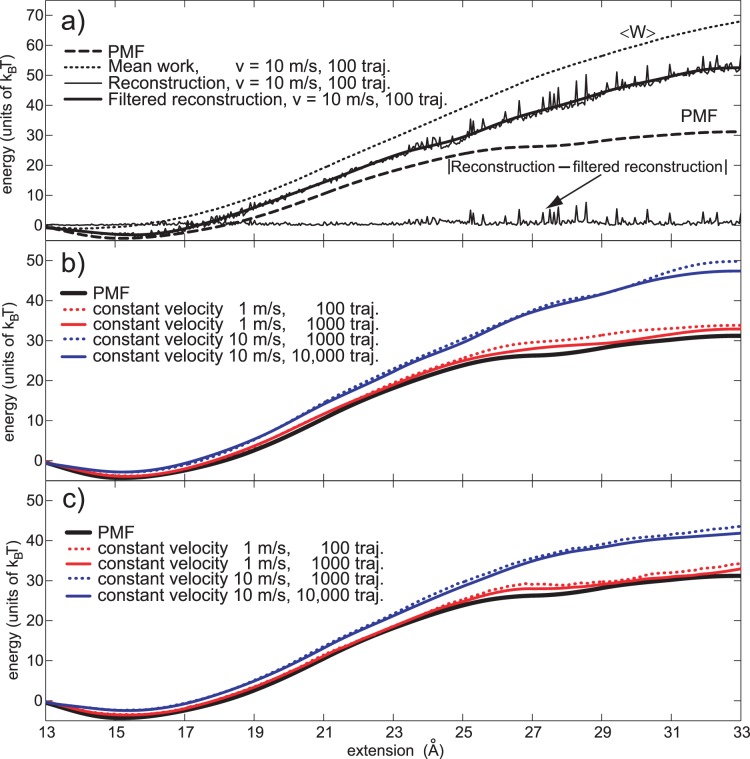
Figure 1. Normal pulling based estimates a) Jarzynski based PMF estimate based on the normal 10 m/s pulling and limited number of trajectories (100).
The thin and “noisy” line is the estimate, and the thick line passing through it is its smoothed version. The line on the bottom is the absolute difference between the estimate and its smoothed version; it represents the estimate’s fluctuations. We used these fluctuations to analyze the behavior and determine the maximum bias of our estimates. The dashed line is PMF. The dotted line is the mean work. b) PMF estimates based on the normal pulling protocol and the Jarzynski equality, for 1 m/s and 10 m/s pulling velocities. c) PMF estimates based on the normal pulling protocol and the cumulant expansion formula, for 1 m/s and 10 m/s pulling velocities. For each pulling velocity two estimates are given, one based on the maximum number of work trajectories, and the other on 10 times less trajectories. With the slower pulling, we used fewer trajectories in order to make the comparison on equal terms, i.e., using the same computational cost.

