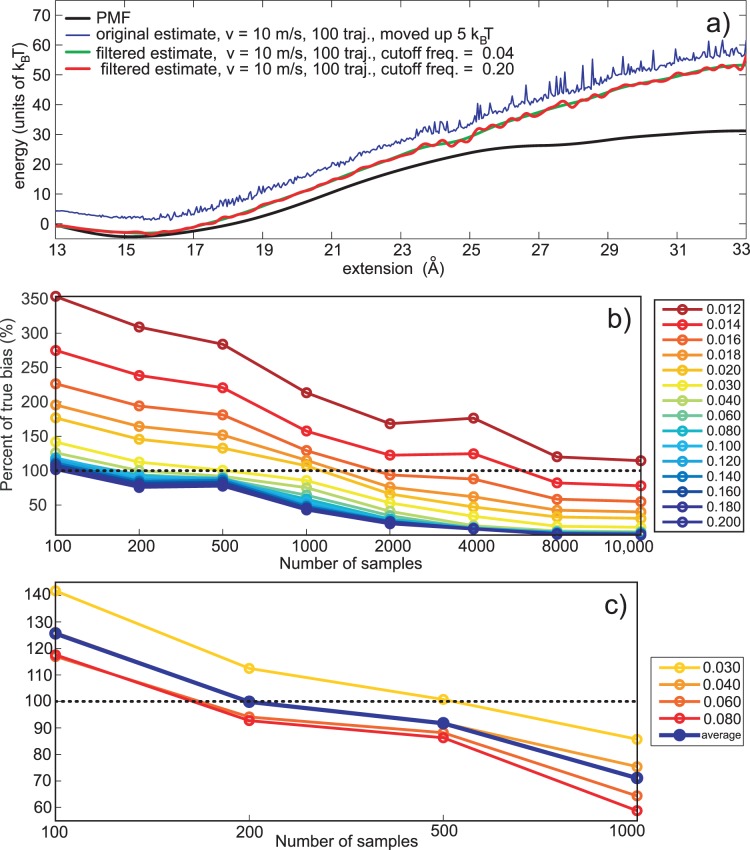
Figure 2. Maximum bias estimation.
a) Original PMF estimate (blue line, moved up by 5 KBT for a clearer picture) in comparison to its two filtered (smoothed) versions. The first version (the green one) is produced by applying a low pass filter (Butterworth) with a very low cutoff frequency (2% of the sampling frequency). The second filtered output (the red one) is also produced by the low pass filtering, but with a much higher cutoff frequency (20% of the sampling frequency). b) Quality of the bias estimating based on the low-pass filtering technique. The quality is expressed as the percent of the true bias predicted for a given number of pulling trajectories. The cutoff frequencies are in the range 0.012 to 0.20 (1.2 to 20%) of the sampling frequency. The dashed line designates the actual bias for a given number of trajectories. c) Maximum bias predictor behavior for a limited number of work trajectories per reconstruction (100 to 1000). The behavior of the maximum bias predictor (red line), as an average of four predictors based on 4 different cutoff frequencies, (0.03, 0.04, 0.06 and 0.08, blue lines).

