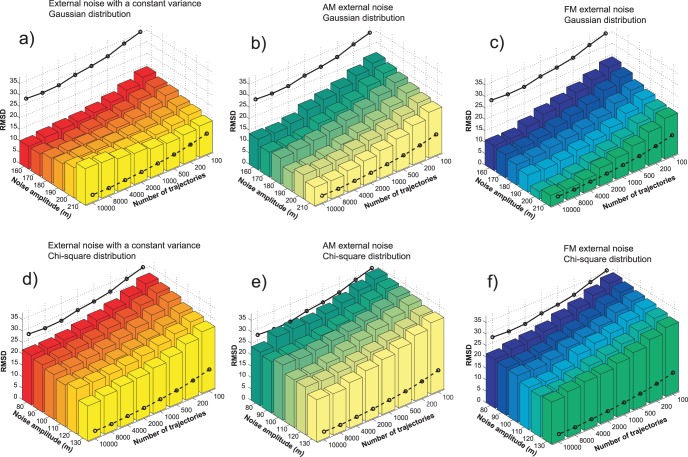
Figure 7. PMF reconstruction quality expressed as the relative RMSD, for the reconstructions calculated with the Jarzynski equality.
The pulling trajectories were generated using the three stochastic perturbation protocols (constant variance noise, AM noise and FM noise). The noise amplitude m was in the range between 160 and 210, for the Gaussian distribution of the pulling point (panels a, b and c), and between 80 and 130, for the chi-square distribution of the pulling point (panels d, e and f). The full line represents the reconstruction quality for the normal pulling and 10 m/s velocity. The dashed line is the reconstruction quality for the normal pulling and 1 m/s velocity.

