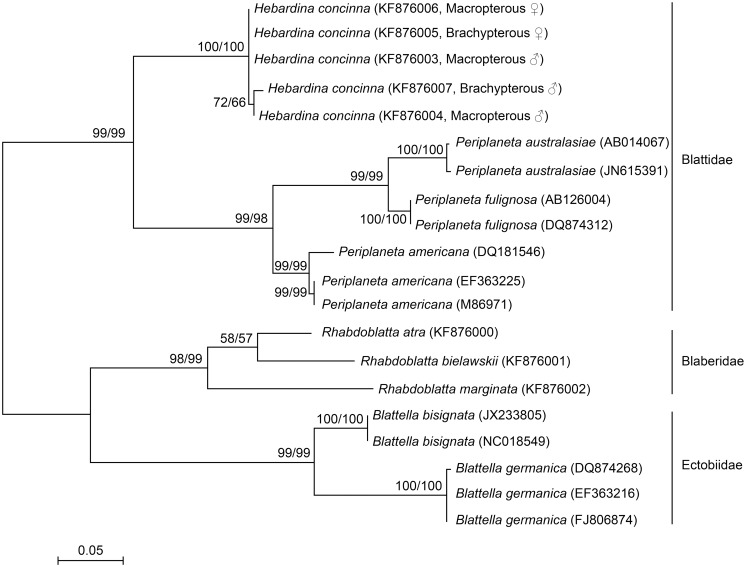
Figure 6. Distance matrix/neighbor joining phylogenetic tree based on 306 bp of aligned cockroach COII nucleotide sequences.
The maximum likelihood tree was topologically identical, although with differing branch lengths. Numbers on branches represent support from 1000 non-parametric bootstrap replicates for distance matrix-NJ analysis and maximum likelihood analysis, respectively. Missing numbers indicate branches with less than 50% support. This analysis clearly supports grouping of the five H. concina individuals as a single species.

