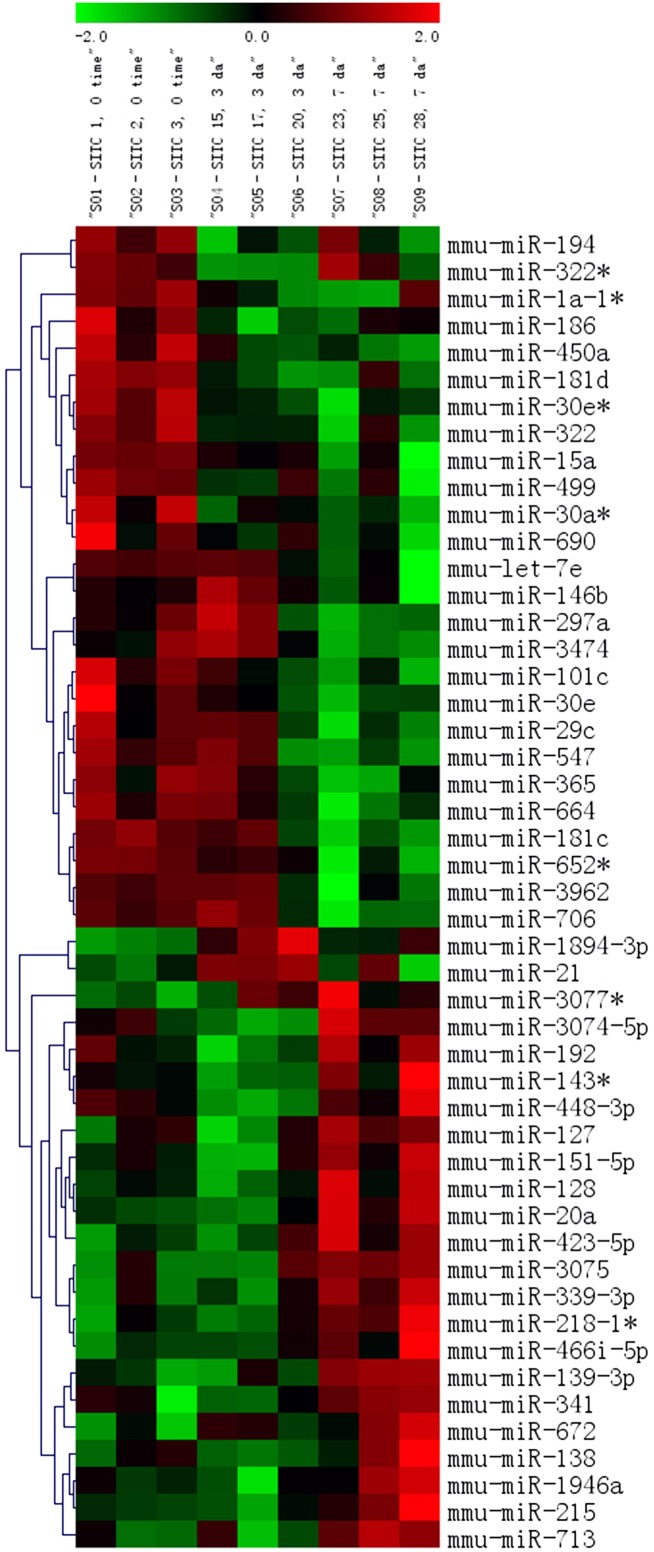
Figure 7. Cardiac miRNA expression profiling after LPS.
Cardiac miRNA expression profiling in C57/Bl6 mice injected with i.p. saline (time 0, control), or with hearts harvested 3 or 7 days after LPS (10 mg/kg) (n = 3 mice each time period). Heat map shows miR expression that increased (red), did not change (black) or decreased (green) for three mice each at time 0 (control, columns 1–3), 3 days after LPS (columns 4–6), and 7 days after LPS (columns 7–9), with differences between the three time periods with a p-value of<0.10 (ANOVA).

