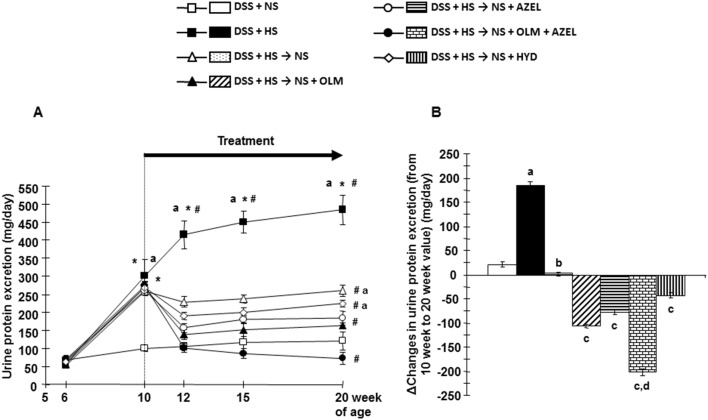
Figure 2. Urine protein excretion profile in Protocol 2.
A, Twenty-four-hour urine protein excretion. B, Delta changes in urine protein excretion were calculated by deducting 10-week values from 20-week values of each respective group. *P<0.05 vs. baseline values of each respective group. # P<0.05 vs. 10-week values of each respective group or of the DSS + HS group. a P<0.05 vs. DSS + NS, b P<0.05 vs. DSS + HS, c P<0.05 vs. DSS + HS → NS, d P<0.05 vs. DSS + HS → NS + OLM or DSS + HS → NS + AZEL.

