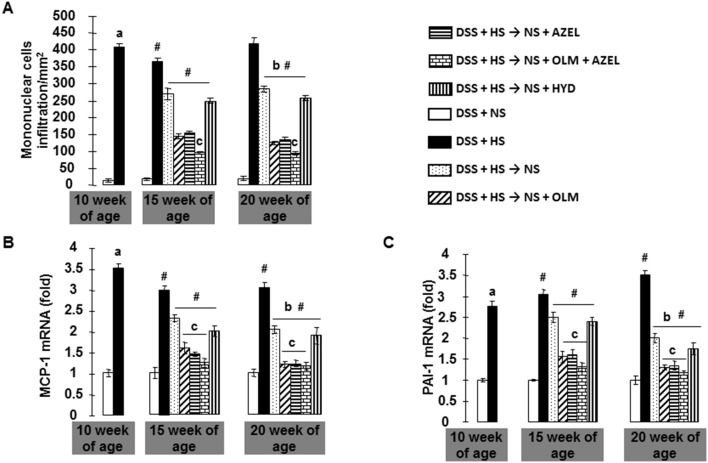
Figure 6. Cellular infiltration and proinflammatory cytokine mRNA levels in Protocol 2.
A, The number of mononuclear cells in the interstitial space of the kidney was quantified. Renal cortical tissues (B) monocyte chemoattractant protein 1 (MCP-1), and (C) plasminogen activator inhibitor 1 (PAI-1) mRNA levels were determined by real time RT-PCR. β-actin was used as an internal control and results are expressed as fold changes to 10-week values of the DSS + NS group. # P<0.05 vs. 10-week values of DSS + HS group. a P<0.05 vs. DSS + NS, b P<0.05 vs. DSS + HS, c P<0.05 vs. DSS + HS → NS, d P<0.05 vs. DSS + HS → NS + OLM or DSS + HS → NS + AZEL.

