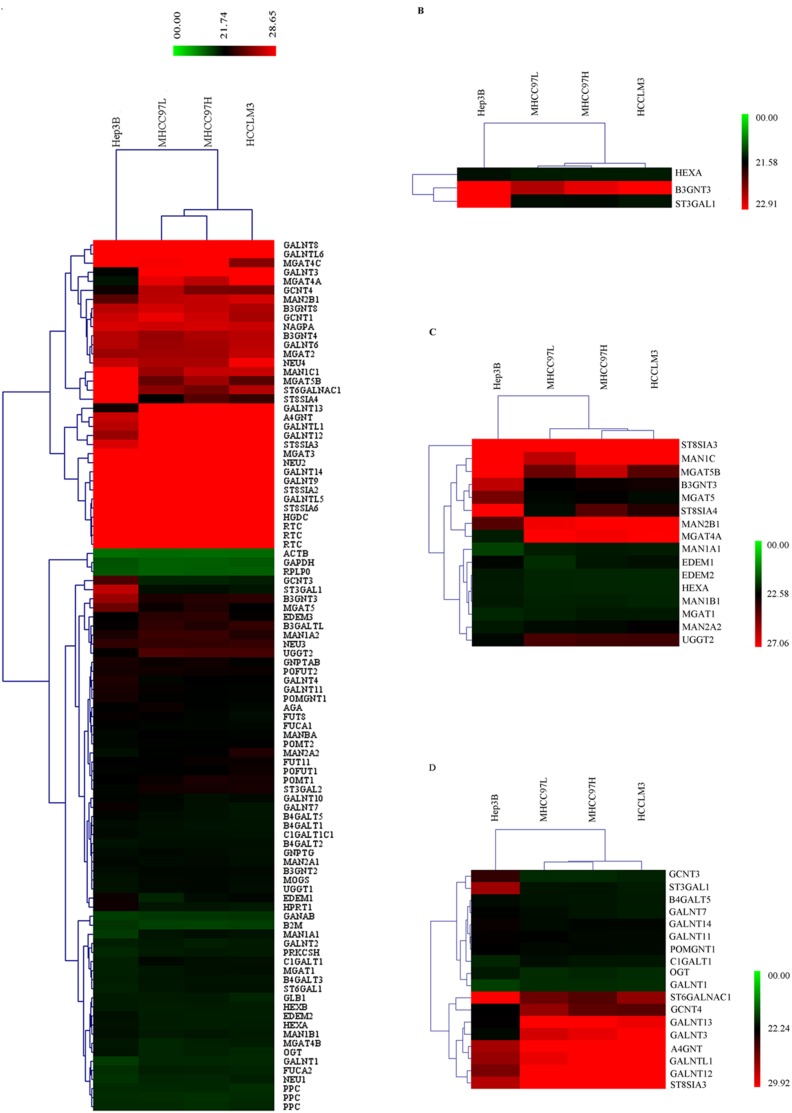
Figure 1. Hierarchical clustering.
(A) Hierarchical clustering of 84 glycogenes. Each row represented a single gene; each column represented a cell line. The expression levels of glycogenes, which were the average value of three test results, were shown by the color scale: red represents a target gene with high Ct value while green represents a target gene with low Ct value. (B) Hierarchical clustering of 3 glycogenes acted on glycosphingolipids. (C) Hierarchical clustering of 16 glycogenes generated and altered mature N-linked glycans. (D) Hierarchical clustering of 18 glycogenes generated and altered mature O-linked glycans.

